Myeloid lineage skewing due to exacerbated NF-κB signaling facilitates osteopenia in Scurfy mice
- PMID: 25880090
- PMCID: PMC4650554
- DOI: 10.1038/cddis.2015.87
Myeloid lineage skewing due to exacerbated NF-κB signaling facilitates osteopenia in Scurfy mice
Abstract
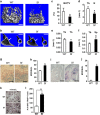
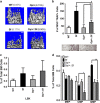
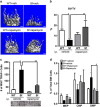
Immune surveillance through Foxp3+ regulatory T cells plays a crucial role in bone homeostasis. Scurfy, the mouse model of autoimmune IPEX syndrome, bears a loss-of-function mutation in Foxp3 that leads to multi-organ inflammation. Herein, we report that scurfy mice exhibit severe bone loss mediated by accelerated osteoclastogenesis. Mechanistically, Foxp3 deficiency results in the upregulation of NF-κB in T helper cells through the loss of repressive Foxp3/NEMO interaction, thereby unleashing NF-κB-mediated over-production of pro-osteoclastogenic cytokines. Flow cytometry analysis shows marked increase in lin-Sca-1+c-kit+ hematopoietic stem cells (LSK HSCs) and granulocyte/macrophage progenitors (GMPs) in bone marrow of scurfy mice with corresponding exacerbated osteoclastogenic potential, implying that osteoclast progenitors are affected at a very primitive stage in this disorder. Scurfy LSK HSCs exhibit greater sensitivity to M-CSF and contain abundant PU.1+ Sf LSK HSCs compared with WT. Accordingly, genetic or pharmacological inhibition of M-CSF or mTOR signaling, but not IL-17 signaling, attenuates osteoclastogenesis and osteopenia in scurfy. Thus, our study suggests that Foxp3 deficiency leads to osteopenia owing to dysregulated NF-κB activity and subsequent cytokine-mediated hyper-proliferation of myeloid precursors, and positions the NF-κB pathway as a potential target for therapeutic intervention for this disorder.
Figures


Similar articles
-
Foxp3+ regulatory T cells ensure B lymphopoiesis by inhibiting the granulopoietic activity of effector T cells in mouse bone marrow.Eur J Immunol. 2015 Jan;45(1):167-79. doi: 10.1002/eji.201444532. Epub 2014 Dec 1. Eur J Immunol. 2015. PMID: 25348202
-
Loss of IKKβ but Not NF-κB p65 Skews Differentiation towards Myeloid over Erythroid Commitment and Increases Myeloid Progenitor Self-Renewal and Functional Long-Term Hematopoietic Stem Cells.PLoS One. 2015 Jun 23;10(6):e0130441. doi: 10.1371/journal.pone.0130441. eCollection 2015. PLoS One. 2015. PMID: 26102347 Free PMC article.
-
Foxp3 interacts with nuclear factor of activated T cells and NF-kappa B to repress cytokine gene expression and effector functions of T helper cells.Proc Natl Acad Sci U S A. 2005 Apr 5;102(14):5138-43. doi: 10.1073/pnas.0501675102. Epub 2005 Mar 24. Proc Natl Acad Sci U S A. 2005. PMID: 15790681 Free PMC article.
-
NF-kappaB p50 and p52 expression is not required for RANK-expressing osteoclast progenitor formation but is essential for RANK- and cytokine-mediated osteoclastogenesis.J Bone Miner Res. 2002 Jul;17(7):1200-10. doi: 10.1359/jbmr.2002.17.7.1200. J Bone Miner Res. 2002. PMID: 12096833
-
Genetic control of the inflammatory T-cell response in regulatory T-cell deficient scurfy mice.Clin Immunol. 2010 Aug;136(2):162-9. doi: 10.1016/j.clim.2010.04.004. Epub 2010 May 8. Clin Immunol. 2010. PMID: 20452830 Free PMC article. Review.
Cited by
-
Clinical, Hematologic, Biologic and Molecular Characteristics of Patients with Myeloproliferative Neoplasms and a Chronic Myelomonocytic Leukemia-Like Phenotype.Cancers (Basel). 2020 Jul 14;12(7):1891. doi: 10.3390/cancers12071891. Cancers (Basel). 2020. PMID: 32674283 Free PMC article.
-
Myelomonocytic Skewing In Vitro Discriminates Subgroups of Patients with Myelofibrosis with A Different Phenotype, A Different Mutational Profile and Different Prognosis.Cancers (Basel). 2020 Aug 14;12(8):2291. doi: 10.3390/cancers12082291. Cancers (Basel). 2020. PMID: 32824053 Free PMC article.
-
The interplay between inflammation and metabolism in rheumatoid arthritis.Cell Death Dis. 2015 Sep 17;6(9):e1887. doi: 10.1038/cddis.2015.246. Cell Death Dis. 2015. PMID: 26379192 Free PMC article. Review.
-
Osteoclasts-Key Players in Skeletal Health and Disease.Microbiol Spectr. 2016 Jun;4(3):10.1128/microbiolspec.MCHD-0011-2015. doi: 10.1128/microbiolspec.MCHD-0011-2015. Microbiol Spectr. 2016. PMID: 27337470 Free PMC article. Review.
-
DNA hypomethylation ameliorates erosive inflammatory arthritis by modulating interferon regulatory factor-8.Proc Natl Acad Sci U S A. 2024 Feb 13;121(7):e2310264121. doi: 10.1073/pnas.2310264121. Epub 2024 Feb 6. Proc Natl Acad Sci U S A. 2024. PMID: 38319963 Free PMC article.
References
-
- 1Harada S-i, Rodan GA. Control of osteoblast function and regulation of bone mass. Nature 2003; 423: 349–355. - PubMed
-
- 3Xing L, Schwarz EM, Boyce BF. Osteoclast precursors, RANKL/RANK, and immunology. Immunol Rev 2005; 208: 19–29. - PubMed
-
- 4Sakaguchi S, Yamaguchi T, Nomura T, Ono M. Regulatory T cells and immune tolerance. Cell 2008; 133: 775–787. - PubMed
-
- 5Zheng Y, Rudensky AY. Foxp3 in control of the regulatory T cell lineage. Nat Immunol 2007; 8: 457–462. - PubMed
Publication types
MeSH terms
Substances
Grants and funding
LinkOut - more resources
Full Text Sources
Other Literature Sources
Research Materials
Miscellaneous

