. 2015 Mar 4;34(1):23.
doi: 10.1186/s13046-015-0137-6.

A pseudogene-signature in glioma predicts survival

Affiliations

A pseudogene-signature in glioma predicts survival

Kai-Ming Gao et al. J Exp Clin Cancer Res. .

Abstract

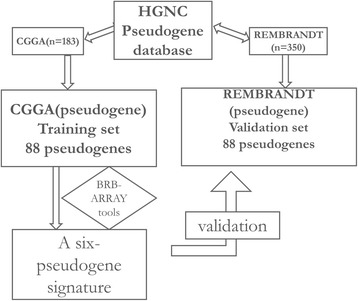
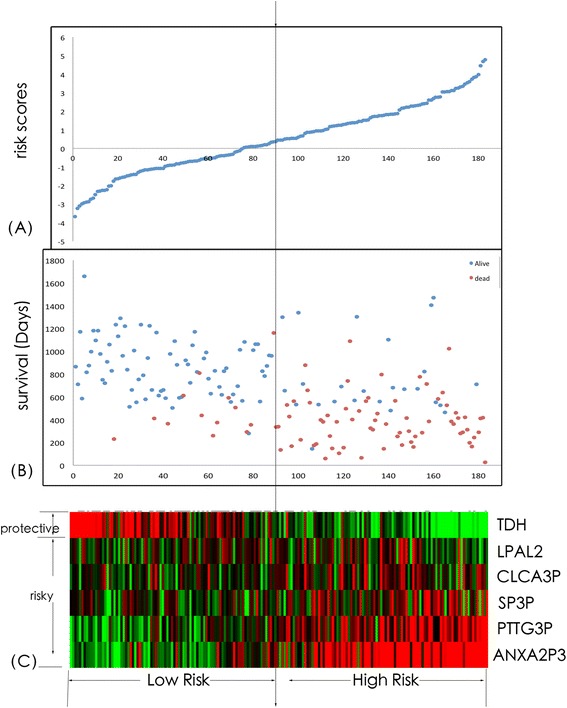
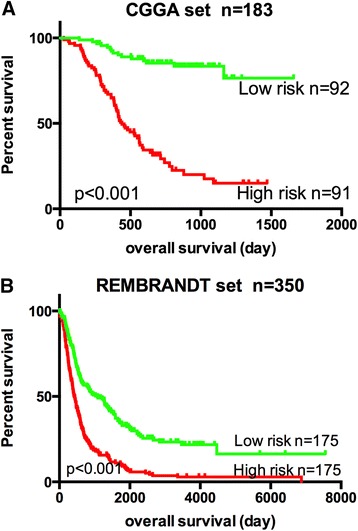
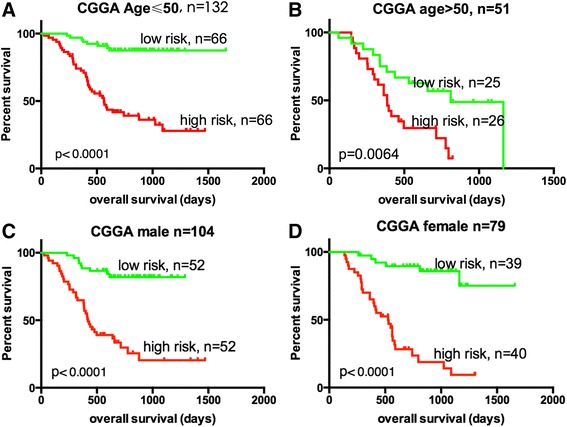
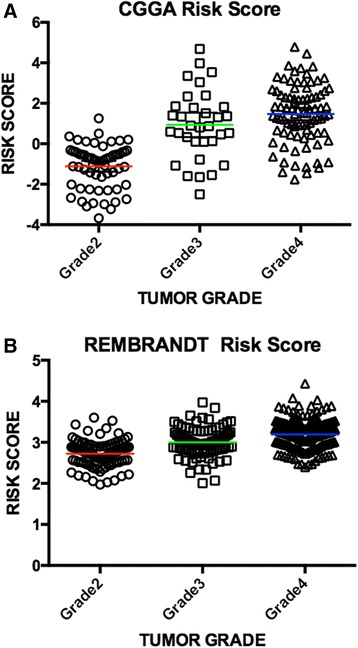
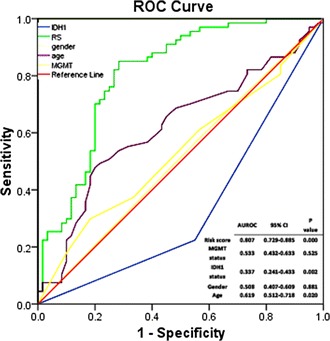
Pseudogene was recognized as a potential tumor suppressor or oncogene in varies of diseases, however its roles in glioma have not been investigated. Our study was to identify the pseudogene-signature that predicted glioma survival. Using a pseudogene-mining approach, we performed pseudogene expression profiling in 183 glioma samples from the Chinese Glioma Genome Atlas (CGGA) and set it as the training set. We found a six-pseudogene signature correlated with patients' clinical outcome via bioinformatics analyses (P ≤ 0.01), and validated it in the Repository of Molecular Brain Neoplasia Data (REMBRANDT) containing 350 cases. A formula calculating the risk score based on the six-pseudogene signature was introduced and the patients of CGGA set were classified into high-risk group and low-risk group with remarkably different survival (P < 0.001) based on their scores. The prognostic value of the signature was confirmed in the REMBRANDT set. Though the function of these pseudogenes is not clear, the identification of the prognostic pseudogenes indicated the potential roles of pseudogenes in glioma pathogenesis and they may have clinical implications in treating glioma.


Figures

Figure 1
Figure 1
Flow chart of our study. Abbreviations: CGGA, the Chinese glioma genome atlas; REMBRANDT, Repository of Molecular Brain Neoplasia Data; HGNC, HUGO Gene Nomenclature Committee; BRB-ARRAY tools, biometric research branch–array tools.
Figure 2
Figure 2
Pseudogene risk score analysis of CGGA patients. The distribution of six-pseudogene risk score, patients’ survival status and pseudogene expression signature were analyzed in the entire CGGA patients (n = 183). The vertical axis in (A) means risk score. The vertical axis in (B) means survival time (days). The dotted line in the middle divided the patients into two groups – one group with low risk score and the other one with high score. As the risk score rising, the patients had a shorter survival time. As the risk score rising, the expression value of TDH lowered, and the other 5 pseudogenes’ ascended, which meant the TDH was a protective one, and the other 5 were risky. (A) Pseudogenes risk score distribution; (B) Patients’ survival status and time; (C) Heatmap of the pseudogene expression profiles. Rows represent pseudogenes, and columns represent patients. The black dotted line represents the median pseudogenes risk score cutoff dividing patients into low-risk and high-risk groups.
Figure 3
Figure 3
Kaplan–Meier estimates of the overall survival of CGGA patients using the six-pseudogene signature. The Kaplan–Meier plots were used to visualize the survival probabilities for the low-risk versus high-risk group of CGGApatients determined on the basis of the median risk score. (A) Kaplan–Meier curves for CGGA training-set patients (n = 183); (B) Kaplan–Meier curves for REMBRANDT patients (n = 350); The tick marks on the Kaplan–Meier curves represent the censored subjects. The differences between the two curves were determined by the two-sided log-rank test. The number of patients at risk was listed below the survival curves.
Figure 4
Figure 4
Kaplan–Meier estimates of the overall survival of CGGA patients using the six-pseudogene signature, stratified by age. Entire CGGA patients (n =183) were first stratified by age (age ≤ 50 or >50). Kaplan–Meier plots were then used to visualize the survival probabilities for the low-risk versus high-risk group of patients determined on the basis of the median risk score from the training-set patients within each age group. (A) Kaplan–Meier curves for younger TCGA patients (age ≤ 50, n = 132); (B) Kaplan–Meier curves for elder CGGA patients (age > 50, n = 51). (C) Kaplan–Meier curves for CGGA patients (male, n = 104); (D) Kaplan–Meier curves for CGGA patients (female, n = 79). The tick marks on the Kaplan–Meier curves represent the censored subjects. The differences between the two curves were determined by the two-sided log-rank test. The number of patients at risk was listed below the survival curves.
Figure 5
Figure 5
Risk score correlate with tumor malignance. (A) In CGGA set, mean risk score rose as the tumor malignance ascending. P value of A-nova test was less than 0.001, which meant the mean risk score differed from tumor grades significantly. (B) In REMBRANDT set, mean risk score rose as the tumor malignance ascending. P value of A-nova test was less than 0.001, which meant the mean risk score differed from tumor grades significantly.
Figure 6
Figure 6
ROC analysis of the sensitivity and specificity of the overall survival prediction by the six-pseudogene risk score, IDH1 status, MGMT expression level, gender and age in CGGA data set. P values were from the comparisons of the area under the ROC (AUROC) of six-pseudogene risk score versus those of MGMT expression level, IDH1 status, gender and age, respectively. As can be seen, the six-pseudogene risk score showed a better prediction of overall survival than age, IDH1 status, and MGMT expression level.

References

    1. Adamson C, Kanu OO, Mehta AI, Di C, Lin N, Mattox AK, et al. Glioblastoma multiforme: a review of where we have been and where we are going. Expert Opin Investig Drugs. 2009;18(8):1061–83. doi: 10.1517/13543780903052764. - DOI - PubMed
    1. Li R, Gao K, Luo H, Luo H, Wang X, Shi Y, et al. Identification of intrinsic subtype-specific prognostic microRNAs in primary glioblastoma. J Exp Clin Cancer Res. 2014;33:9. doi: 10.1186/1756-9966-33-9. - DOI - PMC - PubMed
    1. Zhang XQ, Sun S, Lam KF, Kiang KMY, Pu JKS, Ho ASW, et al. A long non-coding RNA signature in glioblastoma multiforme predicts survival. Neurobiol Dis. 2013;58:123–31. doi: 10.1016/j.nbd.2013.05.011. - DOI - PubMed
    1. Verhaak RG, Hoadley KA, Purdom E, Wang V, Qi Y, Wilkerson M, et al. Integrated genomic analysis identifies clinically relevant subtypes of glioblastoma characterized by abnormalities in PDGFRA, IDH1, EGFR, and NF1. Cancer Cell. 2010;17(1):98–110. doi: 10.1016/j.ccr.2009.12.020. - DOI - PMC - PubMed
    1. Ricard D, Idbaih A, Ducray F, Lahutte M, Hoang-Xuan K, Delattre JY. Primary brain tumours in adults. Lancet. 2012;379(9830):1984–96. doi: 10.1016/S0140-6736(11)61346-9. - DOI - PubMed

Publication types