

The truth about metagenomics: quantifying and counteracting bias in 16S rRNA studies
- PMID: 25880246
- PMCID: PMC4433096
- DOI: 10.1186/s12866-015-0351-6
The truth about metagenomics: quantifying and counteracting bias in 16S rRNA studies
Abstract
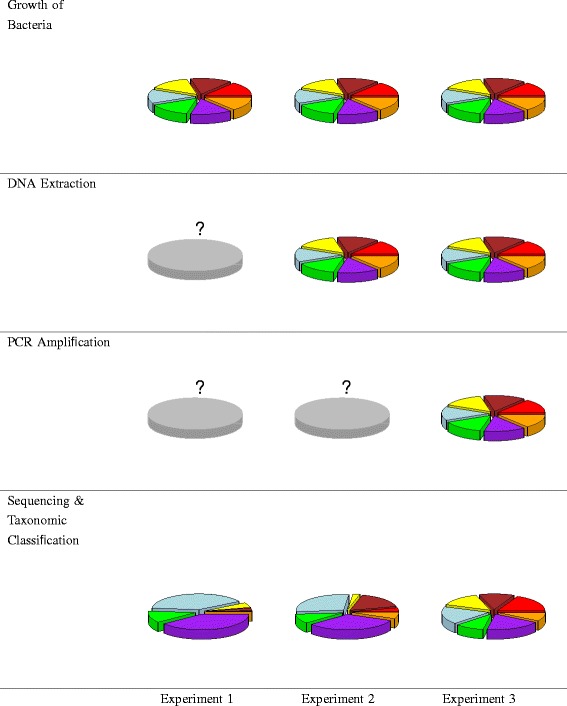
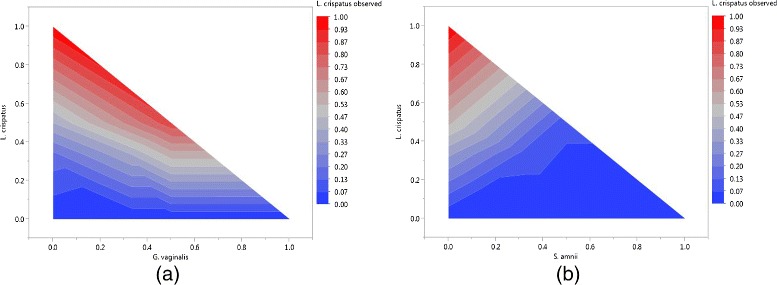
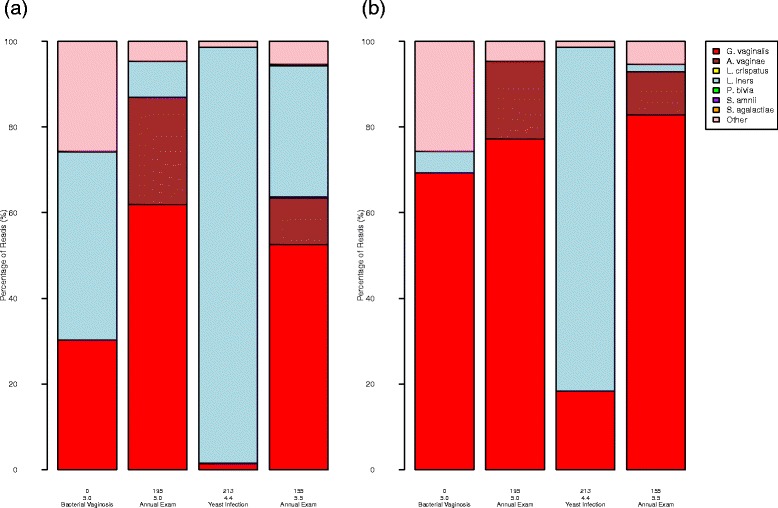
Background: Characterizing microbial communities via next-generation sequencing is subject to a number of pitfalls involving sample processing. The observed community composition can be a severe distortion of the quantities of bacteria actually present in the microbiome, hampering analysis and threatening the validity of conclusions from metagenomic studies. We introduce an experimental protocol using mock communities for quantifying and characterizing bias introduced in the sample processing pipeline. We used 80 bacterial mock communities comprised of prescribed proportions of cells from seven vaginally-relevant bacterial strains to assess the bias introduced in the sample processing pipeline. We created two additional sets of 80 mock communities by mixing prescribed quantities of DNA and PCR product to quantify the relative contribution to bias of (1) DNA extraction, (2) PCR amplification, and (3) sequencing and taxonomic classification for particular choices of protocols for each step. We developed models to predict the "true" composition of environmental samples based on the observed proportions, and applied them to a set of clinical vaginal samples from a single subject during four visits.
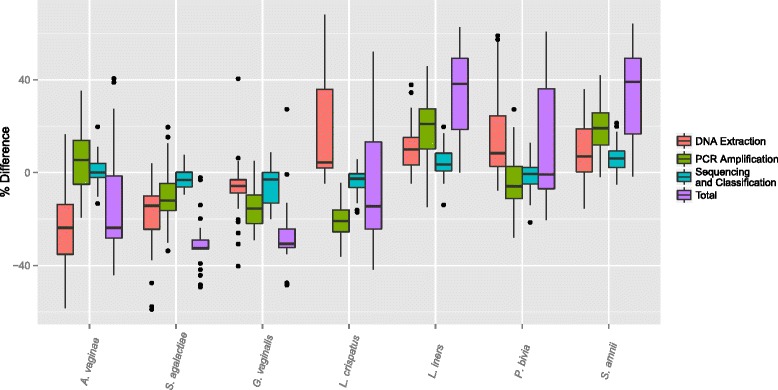
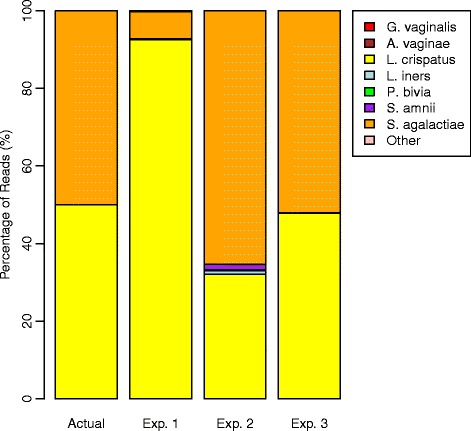
Results: We observed that using different DNA extraction kits can produce dramatically different results but bias is introduced regardless of the choice of kit. We observed error rates from bias of over 85% in some samples, while technical variation was very low at less than 5% for most bacteria. The effects of DNA extraction and PCR amplification for our protocols were much larger than those due to sequencing and classification. The processing steps affected different bacteria in different ways, resulting in amplified and suppressed observed proportions of a community. When predictive models were applied to clinical samples from a subject, the predicted microbiome profiles were better reflections of the physiology and diagnosis of the subject at the visits than the observed community compositions.
Conclusions: Bias in 16S studies due to DNA extraction and PCR amplification will continue to require attention despite further advances in sequencing technology. Analysis of mock communities can help assess bias and facilitate the interpretation of results from environmental samples.
Figures
References
-
- The Microbiome Quality Control Project (MBQC). [http://www.mbqc.org]
Publication types
MeSH terms
Substances
Grants and funding
LinkOut - more resources
Full Text Sources
Other Literature Sources
