

Comparative transcriptome analysis reveals carbohydrate and lipid metabolism blocks in Brassica napus L. male sterility induced by the chemical hybridization agent monosulfuron ester sodium
- PMID: 25880309
- PMCID: PMC4376087
- DOI: 10.1186/s12864-015-1388-5
Comparative transcriptome analysis reveals carbohydrate and lipid metabolism blocks in Brassica napus L. male sterility induced by the chemical hybridization agent monosulfuron ester sodium
Abstract
Background: Chemical hybridization agents (CHAs) are often used to induce male sterility for the production of hybrid seeds. We previously discovered that monosulfuron ester sodium (MES), an acetolactate synthase (ALS) inhibitor of the herbicide sulfonylurea family, can induce rapeseed (Brassica napus L.) male sterility at approximately 1% concentration required for its herbicidal activity. To find some clues to the mechanism of MES inducing male sterility, the ultrastructural cytology observations, comparative transcriptome analysis, and physiological analysis on carbohydrate content were carried out in leaves and anthers at different developmental stages between the MES-treated and mock-treated rapeseed plants.
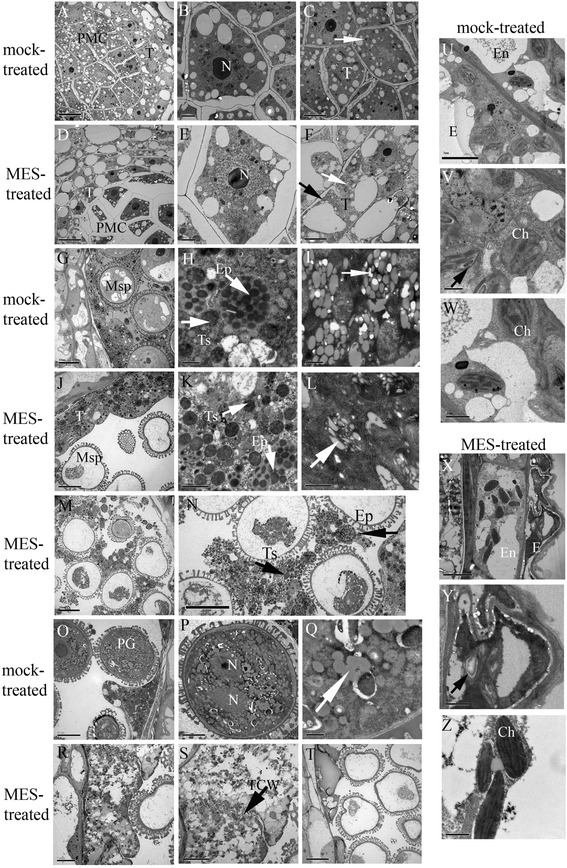
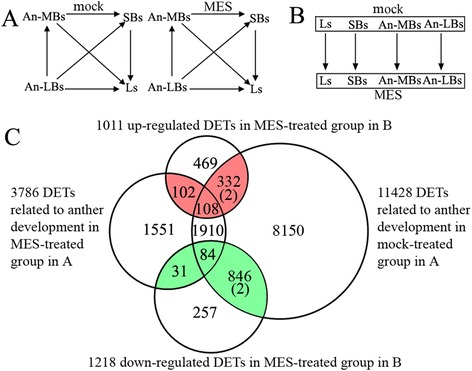
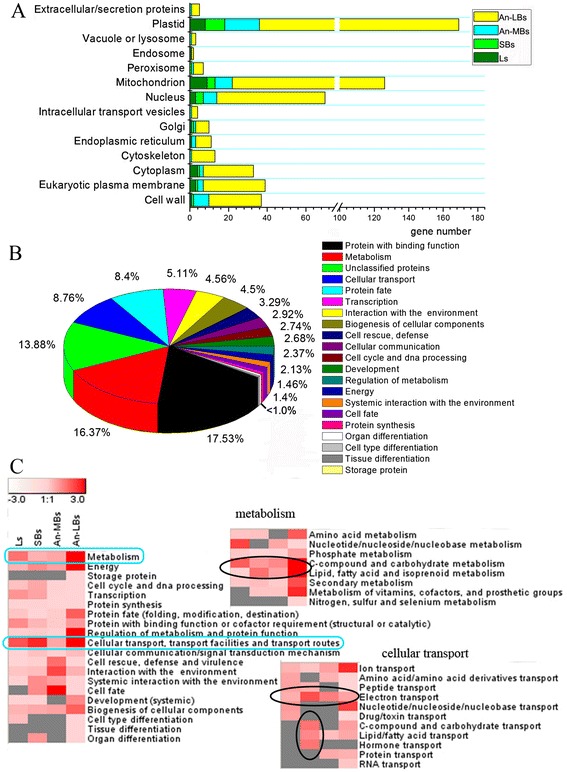
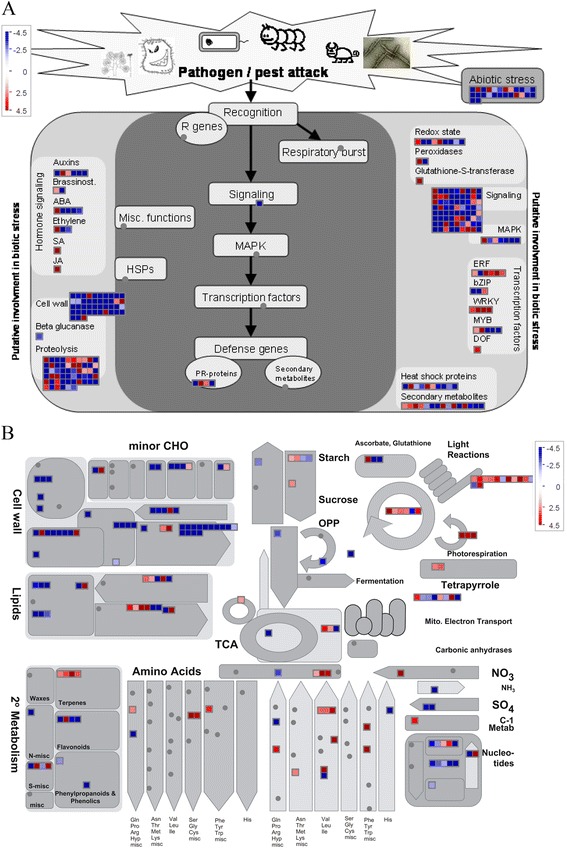
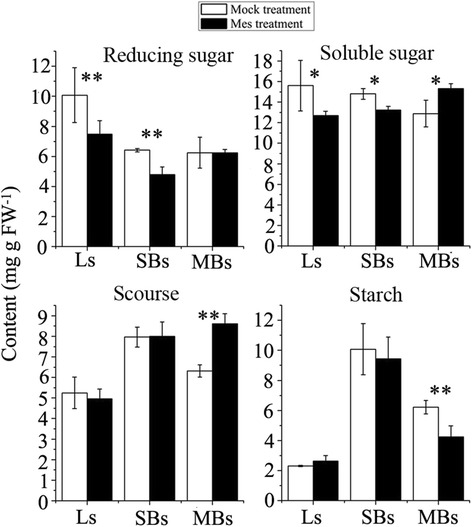
Results: Cytological analysis revealed that the plastid ultrastructure was abnormal in pollen mother cells and tapetal cells in male sterility anthers induced by MES treatment, with less material accumulation in it. However, starch granules were observed in chloroplastids of the epidermis cells in male sterility anthers. Comparative transcriptome analysis identified 1501 differentially expressed transcripts (DETs) in leaves and anthers at different developmental stages, most of these DETs being localized in plastid and mitochondrion. Transcripts involved in metabolism, especially in carbohydrate and lipid metabolism, and cellular transport were differentially expressed. Pathway visualization showed that the tightly regulated gene network for metabolism was reprogrammed to respond to MES treatment. The results of cytological observation and transcriptome analysis in the MES-treated rapeseed plants were mirrored by carbohydrate content analysis. MES treatment led to decrease in soluble sugars content in leaves and early stage buds, but increase in soluble sugars content and decrease in starch content in middle stage buds.
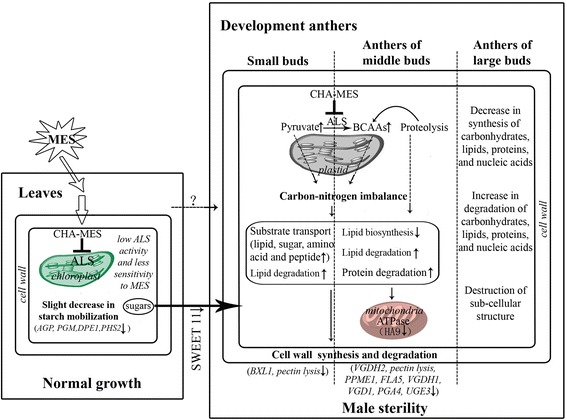
Conclusions: Our integrative results suggested that carbohydrate and lipid metabolism were influenced by CHA-MES treatment during rapeseed anther development, which might responsible for low concentration MES specifically inducing male sterility. A simple action model of CHA-MES inducing male sterility in B. napus was proposed. These results will help us to understand the mechanism of MES inducing male sterility at low concentration, and might provide some potential targets for developing new male sterility inducing CHAs and for genetic manipulation in rapeseed breeding.
Figures
Similar articles
-
The initial deficiency of protein processing and flavonoids biosynthesis were the main mechanisms for the male sterility induced by SX-1 in Brassica napus.BMC Genomics. 2018 Nov 7;19(1):806. doi: 10.1186/s12864-018-5203-y. BMC Genomics. 2018. PMID: 30404610 Free PMC article.
-
Cytological and comparative proteomic analyses on male sterility in Brassica napus L. induced by the chemical hybridization agent monosulphuron ester sodium.PLoS One. 2013 Nov 14;8(11):e80191. doi: 10.1371/journal.pone.0080191. eCollection 2013. PLoS One. 2013. PMID: 24244648 Free PMC article.
-
Tribenuron-Methyl Induces Male Sterility through Anther-Specific Inhibition of Acetolactate Synthase Leading to Autophagic Cell Death.Mol Plant. 2015 Dec 7;8(12):1710-24. doi: 10.1016/j.molp.2015.08.009. Epub 2015 Sep 8. Mol Plant. 2015. PMID: 26362932
-
An overview of cytoplasmic male sterility in Brassica napus.Funct Plant Biol. 2025 May;52:FP24337. doi: 10.1071/FP24337. Funct Plant Biol. 2025. PMID: 40310995 Review.
-
Investigations into the regulation of lipid biosynthesis in Brassica napus using antisense down-regulation.Biochem Soc Trans. 2002 Nov;30(Pt 6):1056-9. doi: 10.1042/bst0301056. Biochem Soc Trans. 2002. PMID: 12440971 Review.
Cited by
-
Genome-Wide Transcriptional Profiling and Metabolic Analysis Uncover Multiple Molecular Responses of the Grass Species Lolium perenne Under Low-Intensity Xenobiotic Stress.Front Plant Sci. 2015 Dec 17;6:1124. doi: 10.3389/fpls.2015.01124. eCollection 2015. Front Plant Sci. 2015. PMID: 26734031 Free PMC article.
-
BnERF114.A1, a Rapeseed Gene Encoding APETALA2/ETHYLENE RESPONSE FACTOR, Regulates Plant Architecture through Auxin Accumulation in the Apex in Arabidopsis.Int J Mol Sci. 2022 Feb 17;23(4):2210. doi: 10.3390/ijms23042210. Int J Mol Sci. 2022. PMID: 35216327 Free PMC article.
-
How exposure to ALS-inhibiting gametocide tribenuron-methyl induces male sterility in rapeseed.BMC Plant Biol. 2019 Apr 2;19(1):124. doi: 10.1186/s12870-019-1722-1. BMC Plant Biol. 2019. PMID: 30940071 Free PMC article.
-
The initial deficiency of protein processing and flavonoids biosynthesis were the main mechanisms for the male sterility induced by SX-1 in Brassica napus.BMC Genomics. 2018 Nov 7;19(1):806. doi: 10.1186/s12864-018-5203-y. BMC Genomics. 2018. PMID: 30404610 Free PMC article.
-
Full-length transcriptome analysis reveals the differences between floral buds of recessive genic male-sterile line (RMS3185A) and fertile line (RMS3185B) of cabbage.Planta. 2021 Jan 5;253(1):21. doi: 10.1007/s00425-020-03542-8. Planta. 2021. PMID: 33399991
References
-
- Coors JG, Pandey S: Proceedings of the International Symposium on the Genetics and Exploitation of Heterosis in Crops. ASA, CSSA, and SSSA, Madison, WI: CIMMYT, Mexico City, Mexico; 1997.
-
- Fehr WR, Hadley HH. Hybridization of Crop Plants. Madison, WI, USA: American Society of Agronomy and Crop Science Society of America; 1980.
-
- Moore RH. Several effects of maleic hydrazide on plants. Science. 1950;112:52–3. - PubMed
Publication types
MeSH terms
Substances
LinkOut - more resources
Full Text Sources
Other Literature Sources
Molecular Biology Databases
Miscellaneous
