

Quantitative analysis of proteins of metabolism by reverse phase protein microarrays identifies potential biomarkers of rare neuromuscular diseases
- PMID: 25880557
- PMCID: PMC4342896
- DOI: 10.1186/s12967-015-0424-1
Quantitative analysis of proteins of metabolism by reverse phase protein microarrays identifies potential biomarkers of rare neuromuscular diseases
Abstract
Background: Muscle diseases have been associated with changes in the expression of proteins involved in energy metabolism. To this aim we have developed a number of monoclonal antibodies against proteins of energy metabolism.
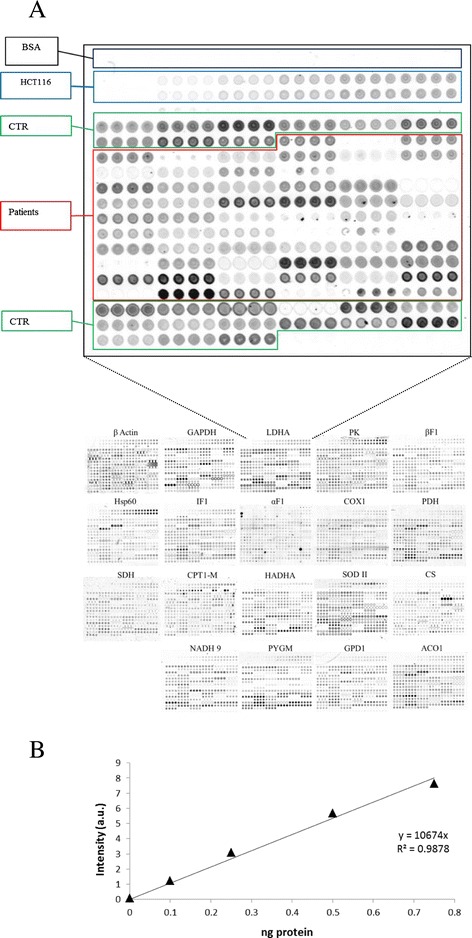
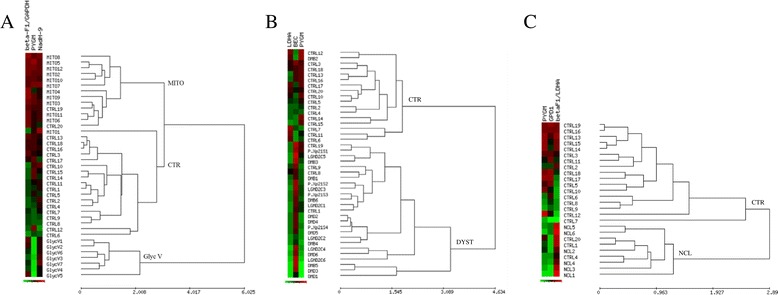
Methods: Herein, we have used Reverse Phase Protein Microarrays (RPMA), a high throughput technique, to investigate quantitative changes in protein expression with the aim of identifying potential biomarkers in rare neuromuscular diseases. A cohort of 73 muscle biopsies that included samples from patients diagnosed of Duchenne (DMD), Becker (BMD), symptomatic forms of DMD and BMD in female carriers (Xp21 Carriers), Limb Girdle Muscular Dystrophy Type 2C (LGMD2C), neuronal ceroid lipofuscinosis (NCL), glycogenosis type V (Mc Ardle disease), isolated mitochondrial complex I deficiency, intensive care unit myopathy and control donors were investigated. The nineteen proteins of energy metabolism studied included members of the mitochondrial oxidation of pyruvate, the tricarboxylic acid cycle, β-oxidation of fatty acids, electron transport and oxidative phosphorylation, glycogen metabolism, glycolysis and oxidative stress using highly specific antibodies.
Results: The results indicate that the phenotype of energy metabolism offers potential biomarkers that could be implemented to refine the understanding of the biological principles of rare diseases and, eventually, the management of these patients.
Conclusions: We suggest that some biomarkers of energy metabolism could be translated into the clinics to contribute to the improvement of the clinical handling of patients affected by rare diseases.
Figures

Similar articles
-
Pyruvate kinase M2 and the mitochondrial ATPase Inhibitory Factor 1 provide novel biomarkers of dermatomyositis: a metabolic link to oncogenesis.J Transl Med. 2017 Feb 10;15(1):29. doi: 10.1186/s12967-017-1136-5. J Transl Med. 2017. PMID: 28183315 Free PMC article.
-
Protein profiling reveals energy metabolism and cytoskeletal protein alterations in LMNA mutation carriers.Biochim Biophys Acta. 2012 Jun;1822(6):970-9. doi: 10.1016/j.bbadis.2012.01.014. Epub 2012 Feb 3. Biochim Biophys Acta. 2012. PMID: 22326558
-
[Diagnostic value of muscle, sural nerve and skin biopsies in childhood neuromuscular disorders].Zhonghua Er Ke Za Zhi. 2006 Dec;44(12):909-12. Zhonghua Er Ke Za Zhi. 2006. PMID: 17254458 Chinese.
-
An Overview of Mitochondrial Protein Defects in Neuromuscular Diseases.Biomolecules. 2021 Nov 4;11(11):1633. doi: 10.3390/biom11111633. Biomolecules. 2021. PMID: 34827632 Free PMC article. Review.
-
Proteomics and neuromuscular diseases: theoretical concept and first results.Ann Clin Biochem. 2003 Jan;40(Pt 1):9-15. doi: 10.1258/000456303321016123. Ann Clin Biochem. 2003. PMID: 12542906 Review.
Cited by
-
Identification of serum protein biomarkers for utrophin based DMD therapy.Sci Rep. 2017 Mar 2;7:43697. doi: 10.1038/srep43697. Sci Rep. 2017. PMID: 28252048 Free PMC article.
-
Down-regulation of oxidative phosphorylation in the liver by expression of the ATPase inhibitory factor 1 induces a tumor-promoter metabolic state.Oncotarget. 2016 Jan 5;7(1):490-508. doi: 10.18632/oncotarget.6357. Oncotarget. 2016. PMID: 26595676 Free PMC article.
-
Glucose Metabolism as a Pre-clinical Biomarker for the Golden Retriever Model of Duchenne Muscular Dystrophy.Mol Imaging Biol. 2018 Oct;20(5):780-788. doi: 10.1007/s11307-018-1174-2. Mol Imaging Biol. 2018. PMID: 29508262 Free PMC article.
-
Effective therapeutic strategies in a preclinical mouse model of Charcot-Marie-Tooth disease.Hum Mol Genet. 2021 Nov 30;30(24):2441-2455. doi: 10.1093/hmg/ddab207. Hum Mol Genet. 2021. PMID: 34274972 Free PMC article.
-
Reducing sarcolipin expression improves muscle metabolism in mdx mice.Am J Physiol Cell Physiol. 2022 Feb 1;322(2):C260-C274. doi: 10.1152/ajpcell.00125.2021. Epub 2022 Jan 5. Am J Physiol Cell Physiol. 2022. PMID: 34986021 Free PMC article.
References
-
- Willers IM, Cuezva JM. Post-transcriptional regulation of the mitochondrial H(+)-ATP synthase: A key regulator of the metabolic phenotype in cancer. Biochim Biophys Acta. 1807;2011:543–51. - PubMed
-
- Cuezva JM, Krajewska M, de Heredia ML, Krajewski S, Santamaria G, Kim H, et al. The bioenergetic signature of cancer: a marker of tumor progression. Cancer Res. 2002;62:6674–81. - PubMed
Publication types
MeSH terms
Substances
LinkOut - more resources
Full Text Sources
Other Literature Sources
Medical
Miscellaneous
