

Phosphorylation of pyruvate kinase M2 and lactate dehydrogenase A by fibroblast growth factor receptor 1 in benign and malignant thyroid tissue
- PMID: 25880801
- PMCID: PMC4393606
- DOI: 10.1186/s12885-015-1135-y
Phosphorylation of pyruvate kinase M2 and lactate dehydrogenase A by fibroblast growth factor receptor 1 in benign and malignant thyroid tissue
Abstract
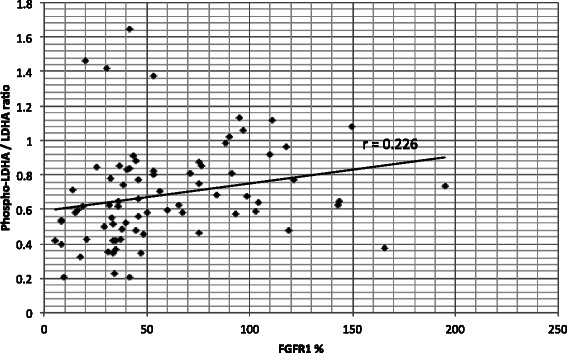
Background: Lactate dehydrogenase A (LDHA) and Pyruvate Kinase M2 (PKM2) are important enzymes of glycolysis. Both of them can be phosphorylated and therefore regulated by Fibroblast growth factor receptor 1 (FGFR1). While phosphorylation of LDHA at tyrosine10 leads to tetramerization and activation, phosphorylation of PKM2 at tyrosine105 promotes dimerization and inactivation. Dimeric PKM2 is found in the nucleus and regulates gene transcription. Up-regulation and phosphorylation of LDHA and PKM2 contribute to faster proliferation under hypoxic conditions and promote the Warburg effect.
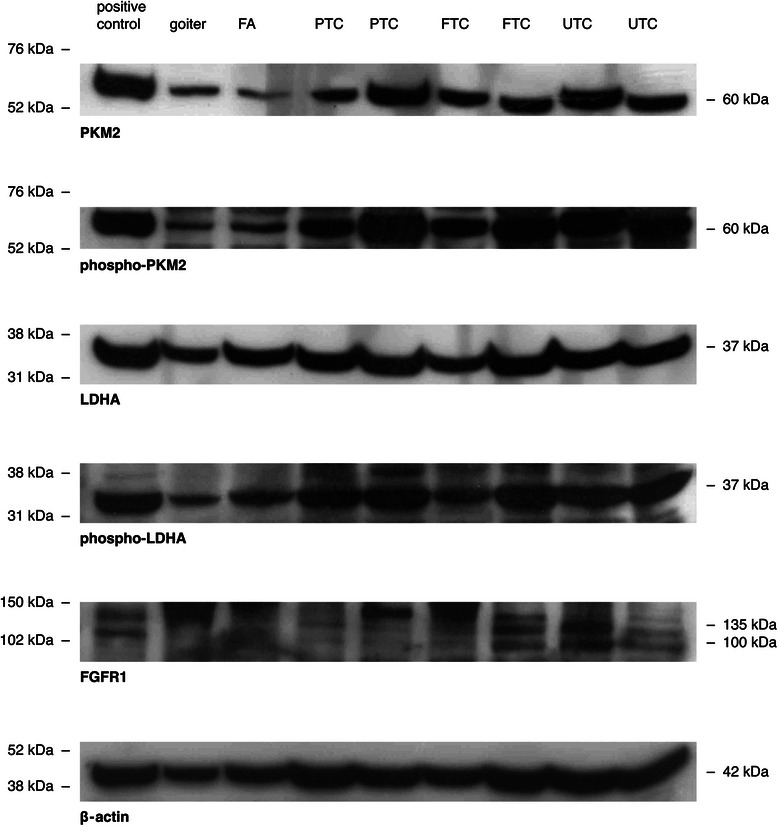
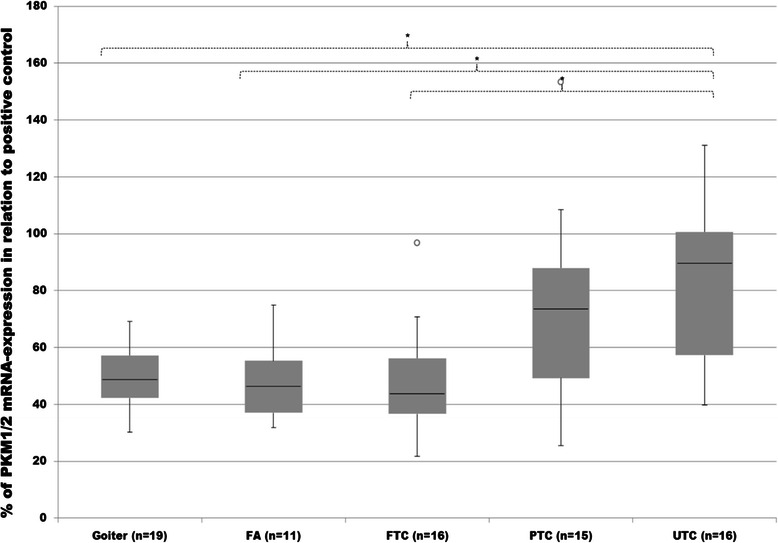
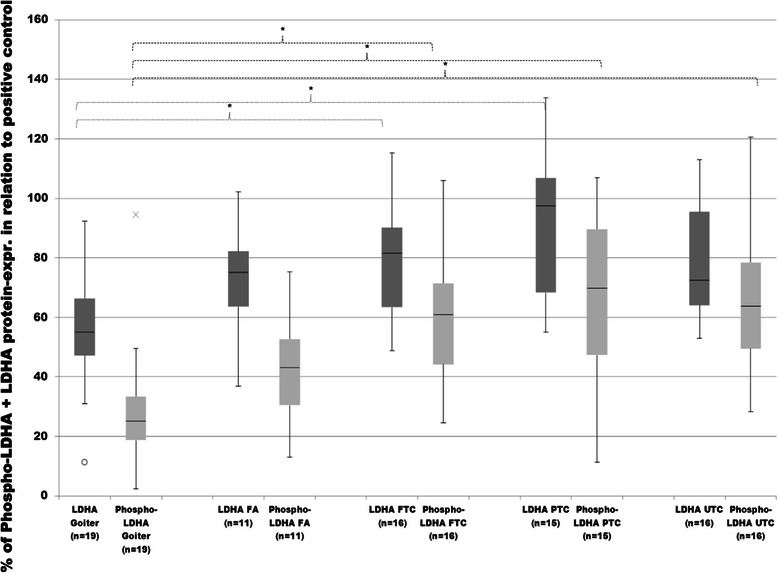
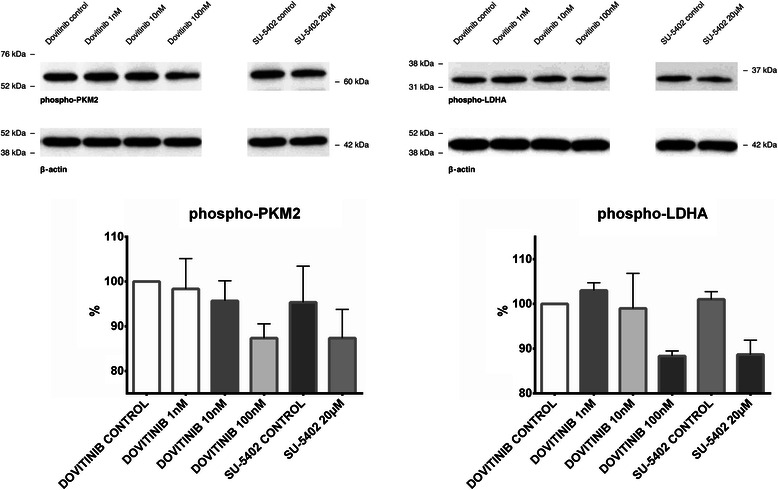
Methods: Using western blot and SYBR Green Real time PCR we investigated 77 thyroid tissues including 19 goiter tissues, 11 follicular adenomas, 16 follicular carcinomas, 15 papillary thyroid carcinomas, and 16 undifferentiated thyroid carcinomas for total expression of PKM2, LDHA and FGFR1. Additionally, phosphorylation status of PKM2 and LDHA was analysed. Inhibition of FGFR was performed on FTC133 cells with SU-5402 and Dovitinib.
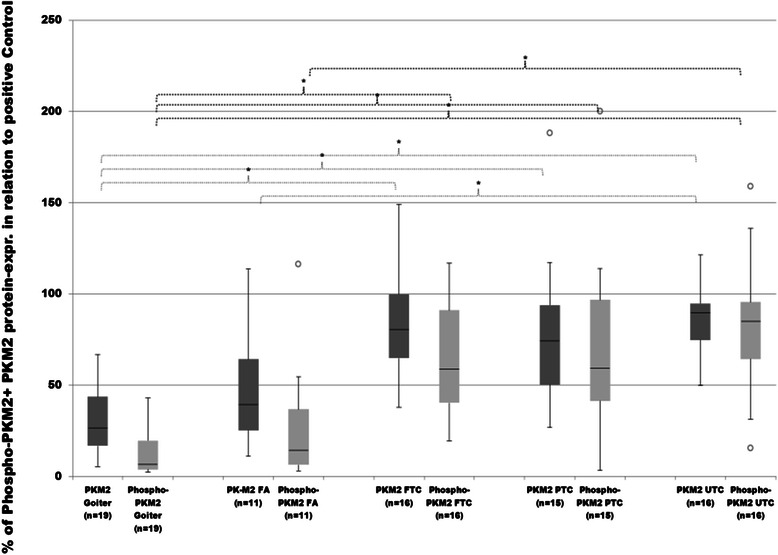
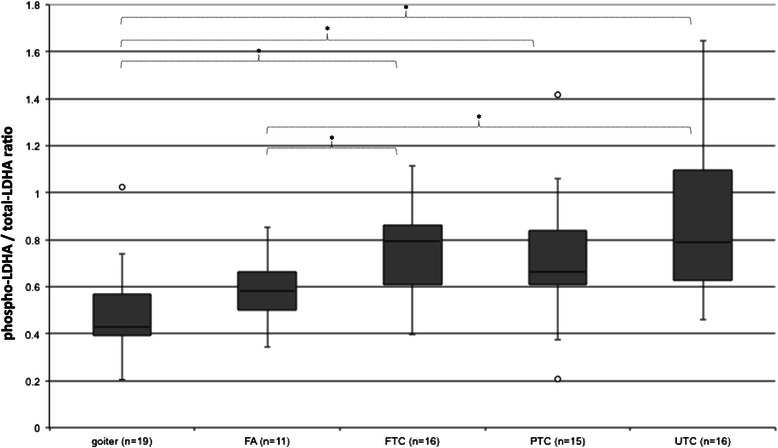
Results: All examined thyroid cancer subtypes overexpressed PKM2 as compared to goiter. LDHA was overexpressed in follicular and papillary thyroid cancer as compared to goiter. Elevated phosphorylation of LDHA and PKM2 was detectable in all analysed cancer subtypes. The highest relative phosphorylation levels of PKM2 and LDHA compared to overall expression were found in undifferentiated thyroid cancer. Inhibition of FGFR led to significantly decreased phosphorylation levels of PKM2 and LDHA.
Conclusions: Our data shows that overexpression and increased phosphorylation of PKM2 and LHDA is a common finding in thyroid malignancies. Phospho-PKM2 and Phospho-LDHA could be valuable tumour markers for thyroglobulin negative thyroid cancer.
Figures


Similar articles
-
STIP1 down-regulation inhibits glycolysis by suppressing PKM2 and LDHA and inactivating the Wnt/β-catenin pathway in cervical carcinoma cells.Life Sci. 2020 Oct 1;258:118190. doi: 10.1016/j.lfs.2020.118190. Epub 2020 Aug 7. Life Sci. 2020. PMID: 32777299
-
ECM1 promotes the Warburg effect through EGF-mediated activation of PKM2.Cell Signal. 2015 Feb;27(2):228-35. doi: 10.1016/j.cellsig.2014.11.004. Epub 2014 Nov 11. Cell Signal. 2015. PMID: 25446258
-
Pyruvate Kinase M2 Modulates Esophageal Squamous Cell Carcinoma Chemotherapy Response by Regulating the Pentose Phosphate Pathway.Ann Surg Oncol. 2015 Dec;22 Suppl 3:S1461-8. doi: 10.1245/s10434-015-4522-3. Epub 2015 Mar 26. Ann Surg Oncol. 2015. PMID: 25808097
-
Rocking cell metabolism: revised functions of the key glycolytic regulator PKM2 in cancer.Trends Biochem Sci. 2012 Aug;37(8):309-16. doi: 10.1016/j.tibs.2012.04.003. Epub 2012 May 23. Trends Biochem Sci. 2012. PMID: 22626471 Review.
-
Activators of PKM2 in cancer metabolism.Future Med Chem. 2014 Jun;6(10):1167-78. doi: 10.4155/fmc.14.70. Future Med Chem. 2014. PMID: 25078136 Review.
Cited by
-
A critical review of the role of M2PYK in the Warburg effect.Biochim Biophys Acta Rev Cancer. 2019 Apr;1871(2):225-239. doi: 10.1016/j.bbcan.2019.01.004. Epub 2019 Jan 29. Biochim Biophys Acta Rev Cancer. 2019. PMID: 30708038 Free PMC article. Review.
-
Anaplastic thyroid carcinoma and foscarnet use in a multitarget treatment documented by 18F-FDG PET/CT: A case report.Medicine (Baltimore). 2017 Feb;96(6):e5621. doi: 10.1097/MD.0000000000005621. Medicine (Baltimore). 2017. PMID: 28178124 Free PMC article.
-
Reprogramming of Thyroid Cancer Metabolism: from Mechanism to Therapeutic Strategy.Mol Cancer. 2025 Mar 11;24(1):74. doi: 10.1186/s12943-025-02263-4. Mol Cancer. 2025. PMID: 40069775 Free PMC article. Review.
-
Design and characteristics of cytotoxic fibroblast growth factor 1 conjugate for fibroblast growth factor receptor-targeted cancer therapy.Drug Des Devel Ther. 2016 Aug 9;10:2547-60. doi: 10.2147/DDDT.S105896. eCollection 2016. Drug Des Devel Ther. 2016. PMID: 27563235 Free PMC article.
-
Long non-coding RNA CCHE1 modulates LDHA-mediated glycolysis and confers chemoresistance to melanoma cells.Cancer Metab. 2023 Jul 21;11(1):10. doi: 10.1186/s40170-023-00309-z. Cancer Metab. 2023. PMID: 37480145 Free PMC article.
References
-
- Warburg O. über den Stoffwechsel der Carcinomzelle. Naturwissenschaften. 1924;12:1131–7. doi: 10.1007/BF01504608. - DOI
-
- Colombo SL, Palacios-Callender M, Frakich N, De Leon J, Schmitt CA, Boorn L, et al. Anaphase-promoting complex/cyclosome-Cdh1 coordinates glycolysis and glutaminolysis with transition to S phase in human T lymphocytes. Proc Natl Acad Sci U S A. 2010;107:18868–73. doi: 10.1073/pnas.1012362107. - DOI - PMC - PubMed
-
- Noguchi T, Inoue H, Tanaka T. The M1-and M2-type isozymes of rat pyruvate kinase are produced from the same gene by alternative RNA splicing. J Biol Chem. 1986;261:13807–12. - PubMed
MeSH terms
Substances
LinkOut - more resources
Full Text Sources
Other Literature Sources
Medical
Molecular Biology Databases
Miscellaneous
