. 2015 Jul;106(7):840-7.
doi: 10.1111/cas.12677. Epub 2015 May 19.

Functional interplay between MYCN, NCYM, and OCT4 promotes aggressiveness of human neuroblastomas

Affiliations

Functional interplay between MYCN, NCYM, and OCT4 promotes aggressiveness of human neuroblastomas

Yoshiki Kaneko et al. Cancer Sci. 2015 Jul.

Abstract

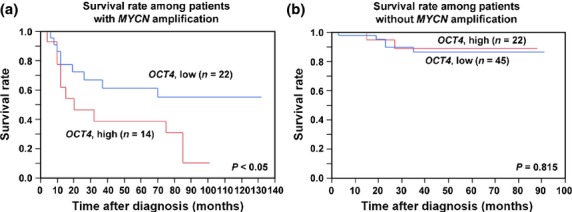
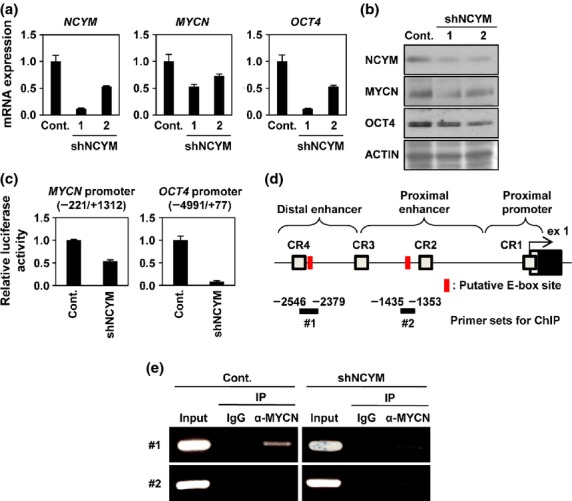
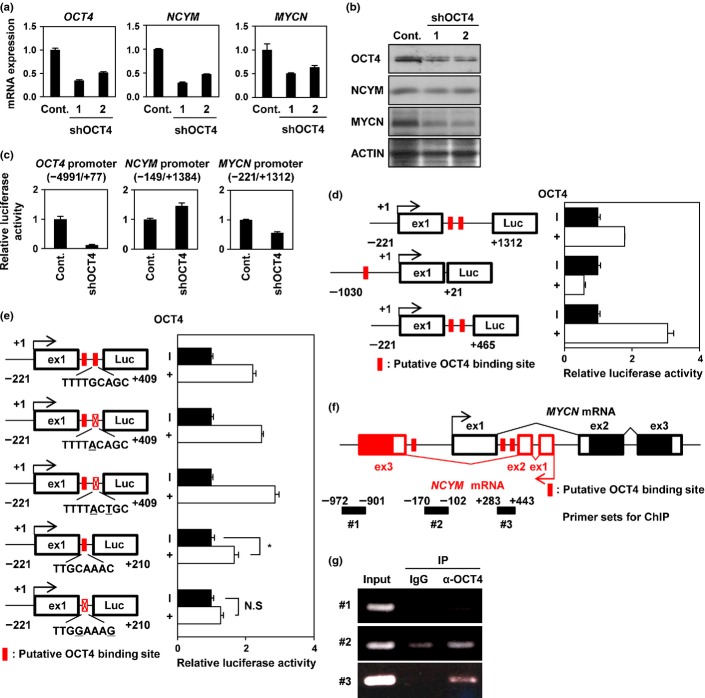
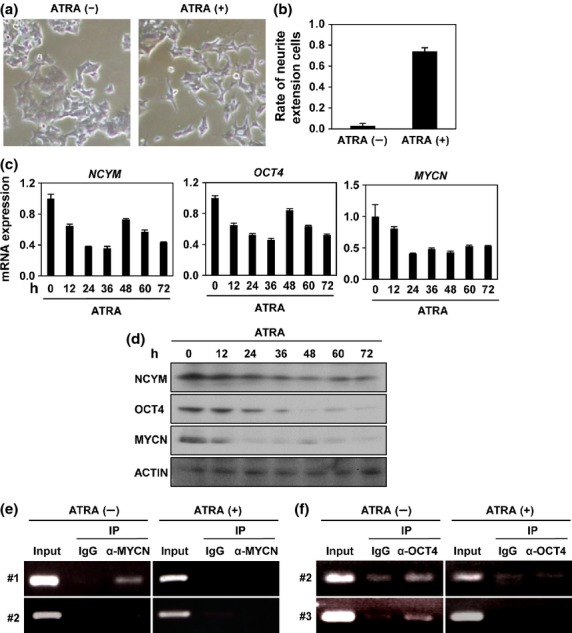
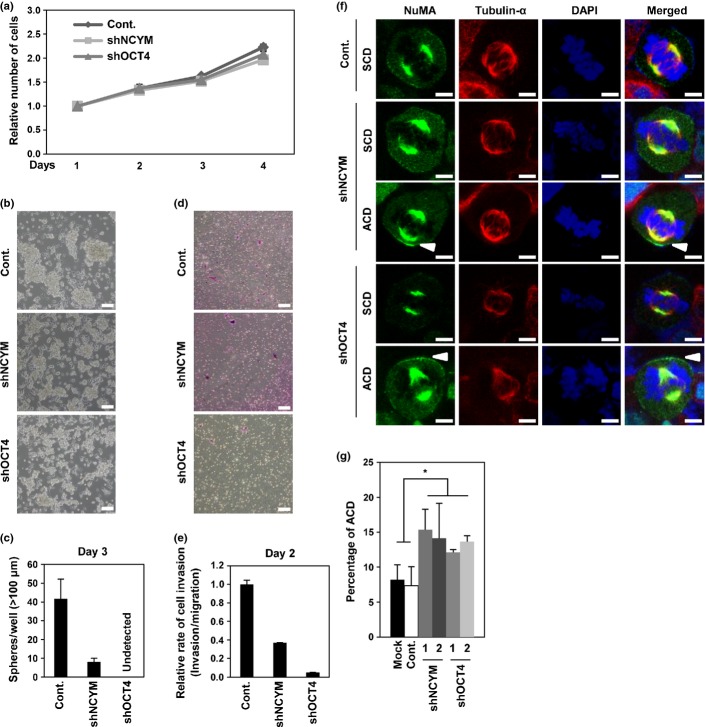
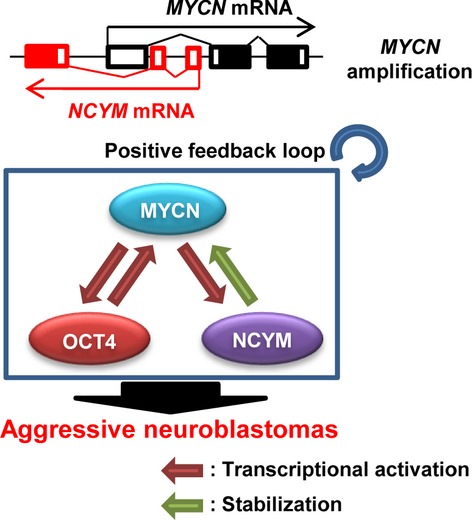
Neuroblastoma is a pediatric solid tumor that originates from embryonic neural crest cells. The MYCN gene locus is frequently amplified in unfavorable neuroblastomas, and the gene product promotes the progression of neuroblastomas. However, the molecular mechanisms by which MYCN amplification contributes to stem cell-like states of neuroblastoma remain elusive. In this study, we show that MYCN and its cis-antisense gene, NCYM, form a positive feedback loop with OCT4, a core regulatory gene maintaining a multipotent state of neural stem cells. We previously reported that NCYM is co-amplified with the MYCN gene in primary human neuroblastomas and that the gene product promotes aggressiveness of neuroblastoma by stabilization of MYCN. In 36 MYCN-amplified primary human neuroblastomas, OCT4 mRNA expression was associated with unfavorable prognosis and was correlated with that of NCYM. The OCT4 protein induced both NCYM and MYCN in human neuroblastoma cells, whereas NCYM stabilized MYCN to induce OCT4 and stem cell-related genes, including NANOG, SOX2, and LIN28. In sharp contrast to MYCN, enforced expression of c-MYC did not enhance OCT4 expression in human neuroblastoma cells. All-trans retinoic acid treatment reduced MYCN, NCYM, and OCT4 expression, accompanied by the decreased amount of OCT4 recruited onto the intron 1 region of MYCN. Knockdown of NCYM or OCT4 inhibited formation of spheres of neuroblastoma cells and promoted asymmetric cell division in MYCN-amplified human neuroblastoma cells. These results suggest that the functional interplay between MYCN, NCYM, and OCT4 contributes to aggressiveness of MYCN-amplified human neuroblastomas.

Keywords: MYCN; NCYM; OCT4; neuroblastoma; transcriptional regulation.


Figures

Fig 1
Fig 1
High OCT4 expression correlates with unfavorable prognosis in human MYCN-amplified neuroblastomas. (a) Overall survival of patients with MYCN-amplified neuroblastomas according to relative OCT4 expression levels (n = 36; high, n = 14; low, n = 22). P-value by log–rank test. (b) Overall survival of patients with MYCN-non-amplified neuroblastomas according to relative OCT4 expression levels (n = 67; high, n = 22; low, n = 45). P-value by log–rank test. OCT4 mRNA expression designated high or low according to the average value.
Fig 2
Fig 2
NCYM regulates OCT4 through the recruitment of MYCN onto the OCT4 promoter region in neuroblastoma cells. (a) Quantitative real-time RT-PCR analyses of NCYM, MYCN, and OCT4 in NCYM shRNA-transfected BE(2)-C intermediate (I)-type neuroblastoma cells. Seventy-two hours after infection, mRNA expression levels were measured by real-time RT-PCR with β-actin as an internal control (Cont.). (b) Western blot analyses of NCYM, MYCN, and OCT4 proteins in NCYM shRNA-transfected BE(2)-C I-type neuroblastoma cells. Seventy-two hours after infection, cells were subjected to Western blot analyses. ACTIN was used as loading control. (c) Luciferase activity of MYCN and OCT4 reporters in NCYM shRNA-transfected BE(2)-C I-type neuroblastoma cells. Seventy-two hours after infection, cells were subjected to luciferase reporter assay. Data are shown as the fold change in the luciferase activity. The activities were standardized by control cells. (d) Schematic depiction of the OCT4 promoter region. The OCT4 promoter is divided into three regions (distal enhancer, distal promoter, and proximal promoter). Each conserved region (CR1–4) and exon 1 of human OCT4 (ex1) are boxed. The gray, white, and black boxes indicate the conserved region, 5′-UTR, and coding region, respectively. The locations of the ChIP primers are indicated by bold lines. The putative E-box sites are shown in red boxes. (e) Identification of the MYCN binding region in the OCT4 promoter by ChIP assays. BE(2)-C I-type neuroblastoma cells were transfected with control shRNA or NCYM sh-1. Seventy-two hours after infection, cells were subjected to ChIP assay. Genomic DNA was amplified by PCR by specific primer sets as shown by bold black lines #1 and #2 in panel (d). The PCR bands indicated in panel #1 indicate amplification of the distal enhancer region; PCR bands indicated in panel #2 indicate amplification of the proximal enhancer region. IP, Immunoprecipitation.
Fig 3
Fig 3
OCT4 induces transcription of MYCN in neuroblastoma cells. (a) Quantitative real-time RT-PCR analysis of NCYM, MYCN, and OCT4 in OCT4 shRNA-transfected BE(2)-C intermediate (I)-type neuroblastoma cells. Seventy-two hours after infection, mRNA expression levels were measured by real-time RT-PCR with β-actin as an internal control (Cont.). (b) Western blot analyses of NCYM, MYCN, and OCT4 proteins in OCT4 shRNA-transfected BE(2)-C I-type neuroblastoma cells. Seventy-two hours after infection, cells were subjected to Western blot analyses. ACTIN was used as loading control. (c) Luciferase activity of OCT4, NCYM, and MYCN reporters after OCT4 shRNA-transfected BE(2)-C I-type neuroblastoma cells. Seventy-two hours after infection, cells were subjected to luciferase reporter assay. Data are shown as the fold change in the luciferase activity. The activities were standardized by control cells. (d) Luciferase activity of MYCN (−221/+1312, −1030/+21, and −221/+465) reporters after OCT4 transfection of SK-N-AS neuroblastoma cells. Forty-eight hours after transfection, cells were subjected to luciferase reporter assay. Data are shown as the fold change in luciferase activity. The activities were standardized by control cells. (e) Luciferase activity of MYCN reporters (−221/+409, −221/+409 mutant 1, −221/+409 mutant 2, −221/+210 mutant, and −221/+409 mutant) after OCT4 transfection of SK-N-AS neuroblastoma cells. Forty-eight hours after transfection, cells were subjected to luciferase reporter assay. Data are shown as the fold change in the luciferase activity. The activities were standardized by control cells. The putative OCT4 binding sites are indicated in red boxes. Statistical significance determined by the Student’s t-test, $P < 0.05. (f) Schematic of the MYCN/NCYM promoter and coding region, divided into three exons (ex 1–3). Each translated region is boxed. The red and black boxes indicate NCYM and MYCN regions, respectively. Locations of the ChIP primers are indicated by the bold line. Putative OCT4 binding sites are indicated by red boxes. (g) Identification of the OCT4 binding region in the MYCN/NCYM region by ChIP assays in BE(2)-C I-type neuroblastoma cells. Seventy-two hours after infection, cells were subjected to ChIP assay. Genomic DNA was amplified by PCR using the primer sets shown in panel (f). IP, Immunoprecipitation.
Fig 4
Fig 4
All-trans retinoic acid (ATRA)-induced neuronal differentiation abrogates the positive autoregulatory loops formed by MYCN, NCYM, and OCT4. (a) Morphology of BE(2)-C intermediate (I)-type neuroblastoma cells treated with or without ATRA. (b) Percentage of BE(2)-C I-type neuroblastoma cells with marked neurite extensions relative to control with or without ATRA. Error bars represent SEM from three independent experiments. (c) Quantitative real-time RT-PCR analysis of NCYM, MYCN and stem cell-related genes in ATRA-treated BE(2)-C I-type neuroblastoma cells. mRNA expression levels were measured by real-time RT-PCR with β-actin as an internal control. (d) Western blot analyses of NCYM, MYCN, and OCT4 proteins in ATRA-treated BE(2)-C I-type neuroblastoma cells. ACTIN was used as loading control. (e) Identification of the MYCN-binding region in the OCT4 promoter by ChIP assays. BE(2)-C I-type neuroblastoma cells were treated with or without ATRA. (f) Identification of the OCT4 binding region in the MYCN/NCYM promoter by ChIP assays. BE(2)-C I-type neuroblastoma cells were treated with or without ATRA.
Fig 5
Fig 5
NCYM and OCT4 control self-renewal of neuroblastoma cells. (a) Cell viability assay of BE(2)-C intermediate (I)-type neuroblastoma cells with NCYM or OCT4 shRNA-mediated knockdown. Cell proliferation was examined by WST assays at the indicated time points. (b) Sphere formation assay of BE(2)-C I-type neuroblastoma cells. Representative images show induction of sphere-forming activity after knockdown of NCYM or OCT4. Scale bar = 100 μm. (c) Quantification of sphere numbers from panel (b). The numbers of spheres were counted 72 h after infection. Error bars represent SEM from three independent experiments. (d) Invasion assay of BE(2)-C I-type neuroblastoma cells. Representative images show invasion activity after knockdown of NCYM or OCT4. Scale bar = 100 μm. (e) Quantification of BE(2)-C I-type neuroblastoma cells invading Matrigel relative to control (Cont.) migration after NCYM or OCT4 shRNA-mediated knockdown from panel (d). The numbers of spheres were counted 48 h after infection. Error bars represent SEM from three independent experiments. (f) Representative images of symmetric distribution of nuclear mitotic apparatus protein (NuMA) during the late stage of mitosis in shRNA-treated neuroblastoma cells. Tubulin-α is indicated in red, NuMA is green, and DNA is blue. Arrows show the distribution of NuMA on the cell cortex. Scale bar = 5 μm. (g) Quantification of cells with asymmetric cell division (ACD) in shRNA-transfected human neuroblastoma cells during late metaphase and anaphase. Error bars represent SEM from three experiments. Statistical significance determined by the Student’s t-test, $P < 0.05. SCD, Symmetric cell division.
Fig 6
Fig 6
Schematic model of MYCN/NCYM–OCT4 networks in MYCN-amplified human neuroblastomas.

Similar articles

Cited by

References

    1. Cheung NK, Dyer MA. Neuroblastoma: developmental biology, cancer genomics and immunotherapy. Nat Rev Cancer. 2013;13:397–411. - PMC - PubMed
    1. Brodeur GM, Seeger RC, Schwab M, Varmus HE, Bishop JM. Amplification of N-myc in untreated human neuroblastomas correlates with advanced disease stage. Science. 1984;224:1121–4. - PubMed
    1. Weiss WA, Aldape K, Mohapatra G, Feuerstein BG, Bishop JM. Targeted expression of MYCN causes neuroblastoma in transgenic mice. EMBO J. 1997;16:2985–95. - PMC - PubMed
    1. Eilers M, Eisenman RN. Myc’s broad reach. Genes Dev. 2008;22:2755–66. - PMC - PubMed
    1. Meyer N, Penn LZ. Reflecting on 25 years with MYC. Nat Rev Cancer. 2008;8:976–90. - PubMed

Publication types

MeSH terms