

Evaluating the performance of anchored hybrid enrichment at the tips of the tree of life: a phylogenetic analysis of Australian Eugongylus group scincid lizards
- PMID: 25880916
- PMCID: PMC4434831
- DOI: 10.1186/s12862-015-0318-0
Evaluating the performance of anchored hybrid enrichment at the tips of the tree of life: a phylogenetic analysis of Australian Eugongylus group scincid lizards
Abstract
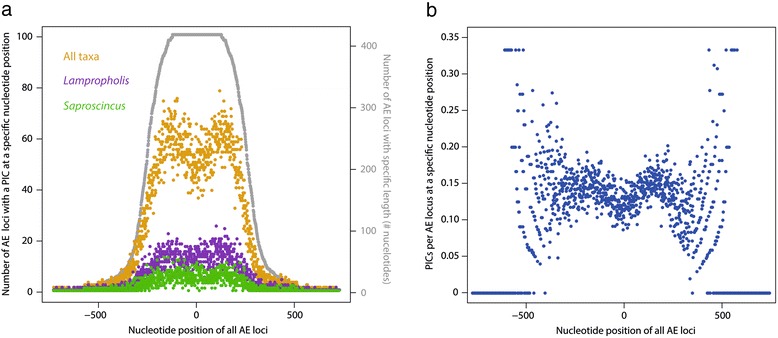
Background: High-throughput sequencing using targeted enrichment and transcriptomic methods enables rapid construction of phylogenomic data sets incorporating hundreds to thousands of loci. These advances have enabled access to an unprecedented amount of nucleotide sequence data, but they also pose new questions. Given that the loci targeted for enrichment are often highly conserved, how informative are they at different taxonomic scales, especially at the intraspecific/phylogeographic scale? We investigate this question using Australian scincid lizards in the Eugongylus group (Squamata: Scincidae). We sequenced 415 anchored hybrid enriched (AHE) loci for 43 individuals and mined 1650 exons (1648 loci) from transcriptomes (transcriptome mining) from 11 individuals, including multiple phylogeographic lineages within several species of Carlia, Lampropholis, and Saproscincus skinks. We assessed the phylogenetic information content of these loci at the intergeneric, interspecific, and phylogeographic scales. As a further test of the utility at the phylogeographic scale, we used the anchor hybrid enriched loci to infer lineage divergence parameters using coalescent models of isolation with migration.
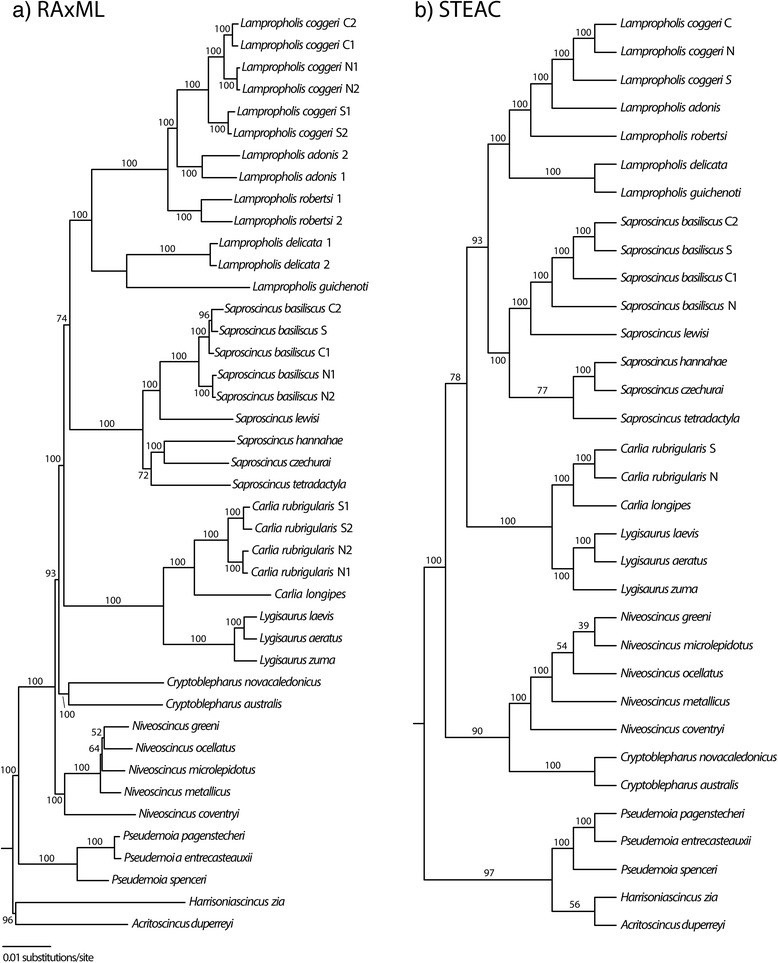
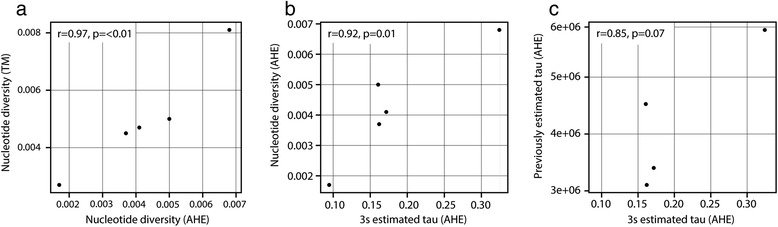
Results: Phylogenetic analyses of both data sets inferred very strongly supported trees at all taxonomic levels. Further, AHE loci yielded estimates of divergence times between closely related lineages that were broadly consistent with previous population-level analyses.
Conclusions: Anchored-enriched loci are useful at the deep phylogeny and phylogeographic scales. Although overall phylogenetic support was high throughout the Australian Eugongylus group phylogeny, there were nonetheless some conflicting or unresolved relationships, especially regarding the placement of Pseudemoia, Cryptoblepharus, and the relationships amongst closely-related species of Tasmanian Niveoscincus skinks.
Figures

Similar articles
-
Phylogenomics of a rapid radiation: the Australian rainbow skinks.BMC Evol Biol. 2018 Feb 5;18(1):15. doi: 10.1186/s12862-018-1130-4. BMC Evol Biol. 2018. PMID: 29402211 Free PMC article.
-
Phylogeny and divergence times of Australian Sphenomorphus group skinks (Scincidae, Squamata).Mol Phylogenet Evol. 2013 Dec;69(3):906-18. doi: 10.1016/j.ympev.2013.06.014. Epub 2013 Jun 28. Mol Phylogenet Evol. 2013. PMID: 23810993
-
Molecular evidence for hybridization between two Australian desert skinks, Ctenotus leonhardii and Ctenotus quattuordecimlineatus (Scincidae: Squamata).Mol Phylogenet Evol. 2009 Nov;53(2):368-77. doi: 10.1016/j.ympev.2009.06.020. Epub 2009 Jul 4. Mol Phylogenet Evol. 2009. PMID: 19580879
-
Evolution of viviparity: what can Australian lizards tell us?Comp Biochem Physiol B Biochem Mol Biol. 2002 Apr;131(4):631-43. doi: 10.1016/s1096-4959(02)00013-1. Comp Biochem Physiol B Biochem Mol Biol. 2002. PMID: 11923079 Review.
-
Estimating rates and patterns of morphological evolution from phylogenies: lessons in limb lability from Australian Lerista lizards.J Biol. 2009;8(2):19. doi: 10.1186/jbiol112. Epub 2009 Feb 24. J Biol. 2009. PMID: 19291259 Free PMC article. Review.
Cited by
-
Genome Evolution and the Future of Phylogenomics of Non-Avian Reptiles.Animals (Basel). 2023 Jan 29;13(3):471. doi: 10.3390/ani13030471. Animals (Basel). 2023. PMID: 36766360 Free PMC article. Review.
-
Phylogenomics of a rapid radiation: the Australian rainbow skinks.BMC Evol Biol. 2018 Feb 5;18(1):15. doi: 10.1186/s12862-018-1130-4. BMC Evol Biol. 2018. PMID: 29402211 Free PMC article.
-
Anchored phylogenomics illuminates the skipper butterfly tree of life.BMC Evol Biol. 2018 Jun 19;18(1):101. doi: 10.1186/s12862-018-1216-z. BMC Evol Biol. 2018. PMID: 29921227 Free PMC article.
-
Comparing species tree estimation with large anchored phylogenomic and small Sanger-sequenced molecular datasets: an empirical study on Malagasy pseudoxyrhophiine snakes.BMC Evol Biol. 2015 Oct 12;15:221. doi: 10.1186/s12862-015-0503-1. BMC Evol Biol. 2015. PMID: 26459325 Free PMC article.
-
Reticulation, divergence, and the phylogeography-phylogenetics continuum.Proc Natl Acad Sci U S A. 2016 Jul 19;113(29):8025-32. doi: 10.1073/pnas.1601066113. Proc Natl Acad Sci U S A. 2016. PMID: 27432956 Free PMC article.
References
-
- Lemmon EM, Lemmon AR. High-throughput genomic data in systematics and phylogenetics. Ann Rev Ecol Evol Syst. 2013;44:99–121. doi: 10.1146/annurev-ecolsys-110512-135822. - DOI
Publication types
MeSH terms
LinkOut - more resources
Full Text Sources
Other Literature Sources
Research Materials
