. 2015 Feb 22:15:43.
doi: 10.1186/s12866-015-0373-0.

Hyperphosphorylation of DegU cancels CcpA-dependent catabolite repression of rocG in Bacillus subtilis

Affiliations

Hyperphosphorylation of DegU cancels CcpA-dependent catabolite repression of rocG in Bacillus subtilis

Kosei Tanaka et al. BMC Microbiol. .

Abstract

Background: The two-component regulatory system, involving the histidine sensor kinase DegS and response regulator DegU, plays an important role to control various cell processes in the transition phase of Bacillus subtilis. The degU32 allele in strain 1A95 is characterized by the accumulation of phosphorylated form of DegU (DegU-P).

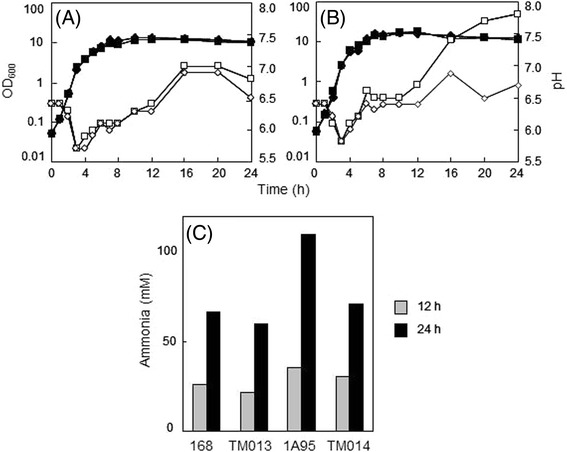
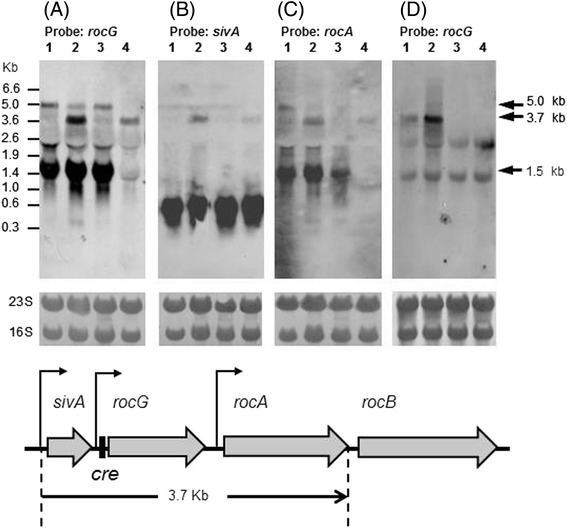
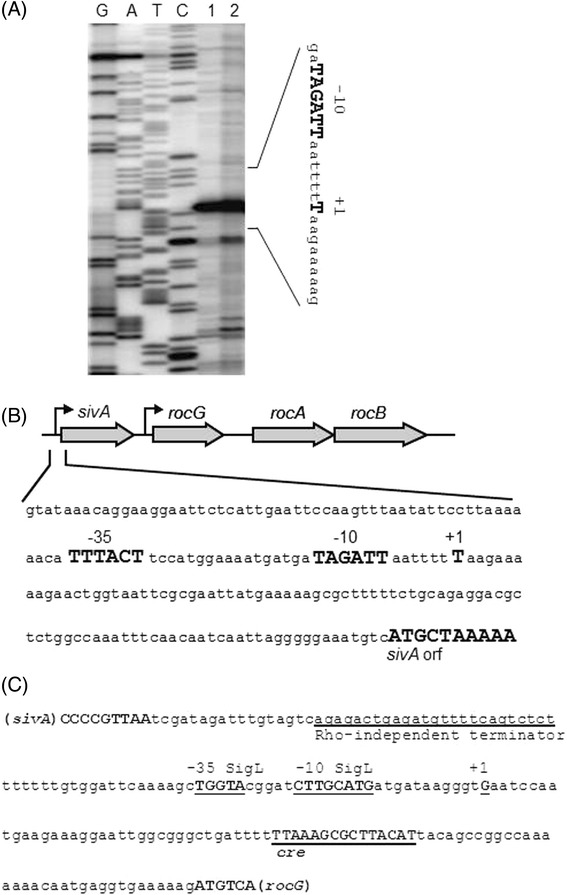
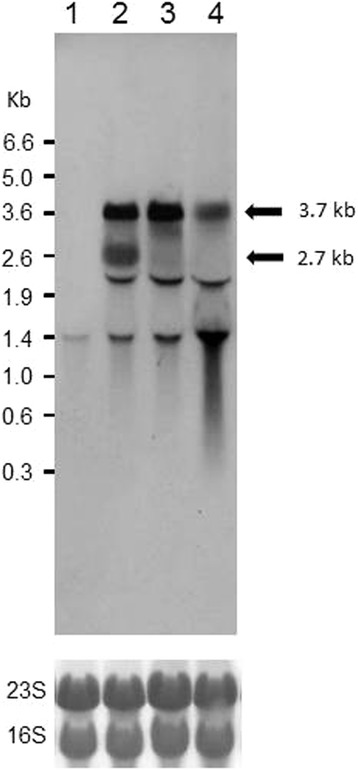
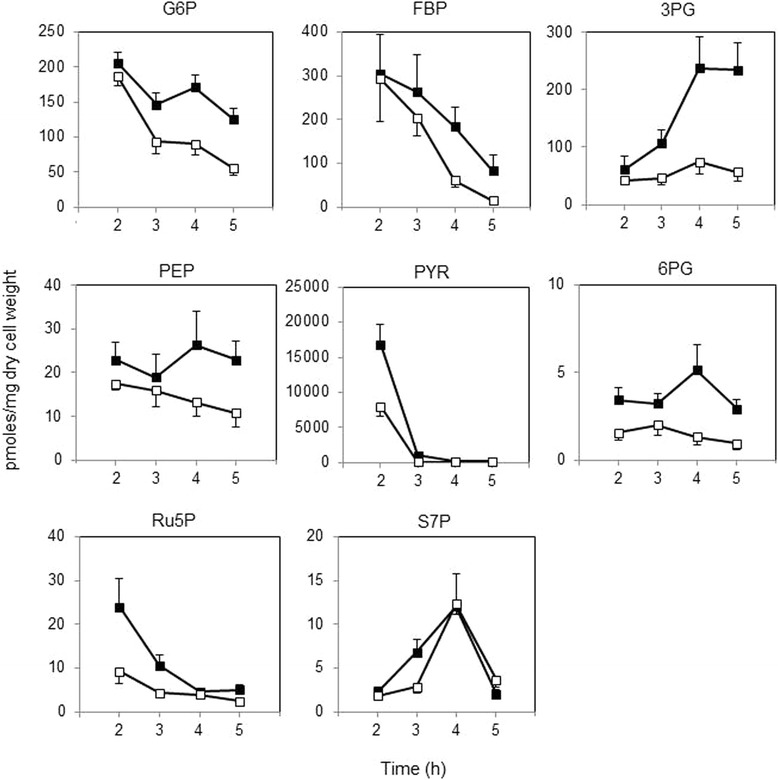
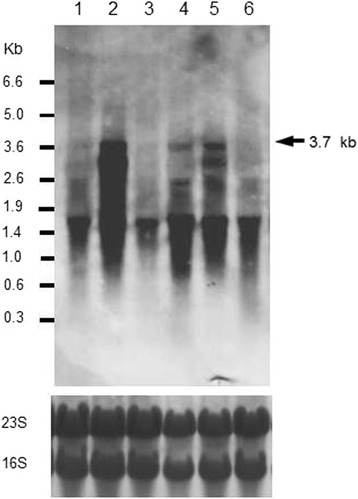
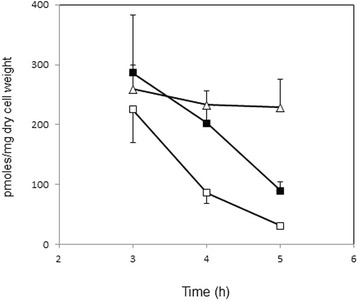
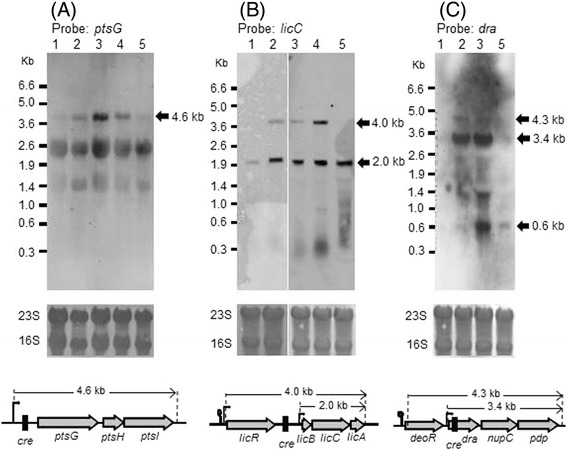
Results: Growing 1A95 cells elevated the pH of soytone-based medium more than the parental strain 168 after the onset of the transition phase. The rocG gene encodes a catabolic glutamate dehydrogenase that catalyzes one of the main ammonia-releasing reactions. Inactivation of rocG abolished 1A95-mediated increases in the pH of growth media. Thus, transcription of the rocG locus was examined, and a novel 3.7-kb transcript covering sivA, rocG, and rocA was found in 1A95 but not 168 cells. Increased intracellular fructose 1,6-bisphosphate (FBP) levels are known to activate the HPr kinase HPrK, and to induce formation of the P-Ser-HPr/CcpA complex, which binds to catabolite responsive elements (cre) and exerts CcpA-dependent catabolite repression. A putative cre found within the intergenic region between sivA and rocG, and inactivation of ccpA led to creation of the 3.7-kb transcript in 168 cells. Analyses of intermediates in central carbon metabolism revealed that intracellular FBP levels were lowered earlier in 1A95 than in 168 cells. A genome wide transcriptome analysis comparing 1A95 and 168 cells suggested similar events occurring in other catabolite repressive loci involving induction of lctE encoding lactate dehydrogenase.

Conclusions: Under physiological conditions the 3.7-kb rocG transcript may be tightly controlled by a roadblock mechanism involving P-Ser-HPr/CcpA in 168 cells, while in 1A95 cells abolished repression of the 3.7-kb transcript. Accumulation of DegU-P in 1A95 affects central carbon metabolism involving lctE enhanced by unknown mechanisms, downregulates FBP levels earlier, and inactivates HPrK to allow the 3.7-kb transcription, and thus similar events may occur in other catabolite repressive loci.


Figures

Figure 1
Figure 1
Involvement of rocG in elevated pH and ammonia levels in the growth medium of strain 1A95 (degU32). (A) Growth curves of B. subtilis strains 168 (closed squares) and TM013 (rocG::cat, closed diamonds) in the soytone–glucose medium; pH values are indicated for 168 (open squares) and TM013 (open diamonds) cultures. (B) Growth curves of strains 1A95 (degU32, closed squares) and TM014 (degU32 rocG::cat, closed diamonds) in the soytone–glucose medium; pH values are indicated for 1A95 (open squares) and TM014 (open diamonds) cultures. (C) Levels of ammonia in media at 12 (gray bars) and 24 (black bars) h after inoculation.
Figure 2
Figure 2
Northern blotting analyses of transcripts containing rocG , sivA , and rocA. RNAs were prepared from 168 (lane 1), 1A95 (degU32, lane 2), TM015 (degU32::cat, lane 3), and TM016 (degU32 rocR::kan, lane 4) cells for northern blotting analyses using probes for rocG (A), sivA (B), and rocA (C) transcripts under low-stringency conditions. (D) RNAs were prepared from 1A95 (degU32, lane 1), TM016 (degU32 rocR::kan, lane 2), TM017 (sivA::pMutin2, lane 3), and TM018 (degU32 sivA::pMutin2, lane 4) cells for northern blotting analyses using probes for rocG transcripts under high-stringency conditions; rRNAs (23S and 16S) on membranes were visualized as a loading control using methylene blue staining. Gene organization of the rocG locus is shown at the bottom.
Figure 3
Figure 3
The promoter and terminator regions of sivA. (A) Primer extension analyses of the sivA promoter region; RNAs were prepared from 168 (lane 1) and 1A95 (degU32, lane 2) cells, and were reverse transcribed to generate cDNAs corresponding to the 5′-terminus of sivA transcripts. Lanes G, A, T, and C contained dideoxy sequencing ladders. The partial nucleotide sequence of the coding strand is shown on the right side, where the putative −10 region and the transcription start site (+1) are shown in enlarged uppercase characters. (B) Schematic presentation of the sivA promoter region. The nucleotide sequence of the upper strand of the promoter region is shown, and putative −35 and −10 regions, the transcription start site (+1), and the beginning of the sivA open reading frame are shown with enlarged uppercase characters. (C) Nucleotide sequence of the intergenic region between sivA and rocG. The C-terminal end of sivA, the Rho-independent terminator, SigL-dependent rocG promoter (+35 and −10 regions), its transcription start site (+1), the cre site, and the N-terminal end of rocG are indicated.
Figure 4
Figure 4
Northern blotting analyses of rocG transcripts in the presence and absence of ccpA. RNAs were prepared from 168 (lane 1), TM023 (ccpA::neo, lane 2), 1A95 (degU32, lane 3), and TM024 (degU32 ccpA::neo, lane 4) cells for northern blotting analyses using a probe for rocG transcripts under high-stringency conditions. Experiments were repeated independently at least three times with similar results, and representative data are shown. At the bottom, rRNAs (23S and 16S) were visualized as loading controls using methylene blue staining.
Figure 5
Figure 5
Intracellular levels of central carbon metabolism intermediates. Cells of 168 (closed squares) and 1A95 (degU32, open squares) strains were grown in the soytone–glucose medium and intracellular metabolites were extracted at the indicated time points after inoculation for CE–MS analyses. Experiments were repeated independently for three times, and the mean values are shown with standard deviation. Intermediates are abbreviated as follows: glucose 6-phosphate, G6P; fructose-1,6-bis-phosphate, FBP; 3-phosphoglyceric acid, 3PG; phosphoenolpyruvate, PEP; pyruvate, PYR; 6-phosphogluconate, 6PG; ribulose 5-phosphate, Ru5P; and sedoheptulose 7-phosphate, S7P.
Figure 6
Figure 6
Northern blotting analysis of rocG transcripts in the presence and absence of lctE. RNAs were prepared from 168 (lane 1), TM023 (ccpA::neo, lane 2), MY02 (lctE::spc, lane 3), 1A95 (degU32, lane 4), TM024 (degU32 ccpA::neo, lane 5), and KI004 (degU32 lctE::spc, lane 6) cells for northern blotting analyses using probes for rocG transcripts under high-stringency conditions. Experiments were repeated independently at least three times with similar results, and representative data are shown. At the bottom, rRNAs (23S and 16S) were visualized as loading controls using methylene blue staining.
Figure 7
Figure 7
Intracellular levels of FBP in the presence and absence of lctE. Cells of 168 (closed squares), 1A95 (degU32, open squares), and KI004 (degU32 lctE::spc, open triangles) cells were grown in the soytone–glucose medium, and intracellular metabolites were extracted at the indicated time points and were analyzed using CE–MS. Experiments were repeated independently for three times, and the mean values are shown with standard deviation.
Figure 8
Figure 8
Northern blotting analyses of transcripts containing ptsG , licC , and dra. RNAs were prepared from 168 (lane 1), TM023 (ccpA::neo, lane 2), 1A95 (degU32, lane 3), TM024 (degU32 ccpA::neo, lane 4), and TM015 (degU32::cat, lane 5) cells for northern blotting analyses using probes for ptsG (A), licC (B), and dra (C) transcripts under higher-stringency conditions. Experiments were repeated independently at least three times with similar results and representative data are shown; rRNAs (23S and 16S) are shown on the membranes as loading controls. Genetic schemas of respective loci are shown below.

Similar articles

Cited by

References

    1. Stock AM, Robinson VL, Goudreau PN. Two-component signal transduction. Annu Rev Biochem. 2000;69:183–215. doi: 10.1146/annurev.biochem.69.1.183. - DOI - PubMed
    1. Msadek T, Kunst F, Henner D, Klier A, Rapoport G, Dedonder R. Signal transduction pathway controlling synthesis of a class of degradative enzymes in Bacillus subtilis: expression of the regulatory genes and analysis of mutations in degS and degU. J Bacteriol. 1990;172:824–34. - PMC - PubMed
    1. Ogura M, Tanaka T. Bacillus subtilis DegU acts as positive regulator for comK expression. FEBS Lett. 1996;397:173–6. doi: 10.1016/S0014-5793(96)01170-2. - DOI - PubMed
    1. Hamoen LW, van Werkhoven AF, Venema G, Dubnau D. The pleiotropic response regulator DegU functions as a priming protein in competence development in Bacillus subtilis. Proc Natl Acad Sci U S A. 2000;97:9246–51. doi: 10.1073/pnas.160010597. - DOI - PMC - PubMed
    1. Márquez LM, Helmann JD, Ferrari E, Parker HM, Ordal GW, Chamberlin MJ. Studies of sigma D-dependent functions in Bacillus subtilis. J Bacteriol. 1990;172:3435–43. - PMC - PubMed

Publication types

MeSH terms

LinkOut - more resources