

The heterogeneity statistic I(2) can be biased in small meta-analyses
- PMID: 25880989
- PMCID: PMC4410499
- DOI: 10.1186/s12874-015-0024-z
The heterogeneity statistic I(2) can be biased in small meta-analyses
Abstract
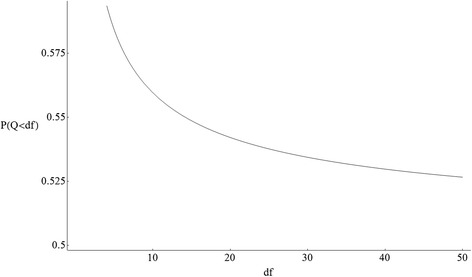
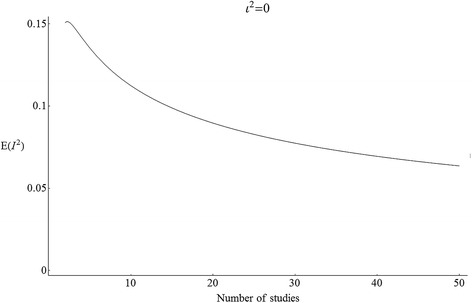
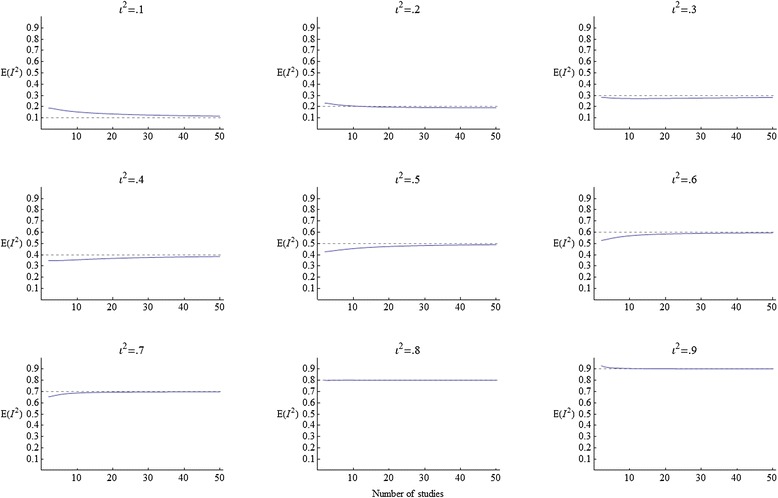
Background: Estimated effects vary across studies, partly because of random sampling error and partly because of heterogeneity. In meta-analysis, the fraction of variance that is due to heterogeneity is estimated by the statistic I(2). We calculate the bias of I(2), focusing on the situation where the number of studies in the meta-analysis is small. Small meta-analyses are common; in the Cochrane Library, the median number of studies per meta-analysis is 7 or fewer.
Methods: We use Mathematica software to calculate the expectation and bias of I(2).
Results: I(2) has a substantial bias when the number of studies is small. The bias is positive when the true fraction of heterogeneity is small, but the bias is typically negative when the true fraction of heterogeneity is large. For example, with 7 studies and no true heterogeneity, I(2) will overestimate heterogeneity by an average of 12 percentage points, but with 7 studies and 80 percent true heterogeneity, I(2) can underestimate heterogeneity by an average of 28 percentage points. Biases of 12-28 percentage points are not trivial when one considers that, in the Cochrane Library, the median I(2) estimate is 21 percent.
Conclusions: The point estimate I(2) should be interpreted cautiously when a meta-analysis has few studies. In small meta-analyses, confidence intervals should supplement or replace the biased point estimate I(2).
Figures

References
-
- Cochran WG. The combination of estimates from different experiments. Biometrics. 1954;10:101–29. doi: 10.2307/3001666. - DOI
MeSH terms
LinkOut - more resources
Full Text Sources
Other Literature Sources
