. 2015 Feb 18:15:66.
doi: 10.1186/s12885-015-1073-8.

Breast and prostate cancer patients differ significantly in their serum Thymidine kinase 1 (TK1) specific activities compared with those hematological malignancies and blood donors: implications of using serum TK1 as a biomarker

Affiliations

Breast and prostate cancer patients differ significantly in their serum Thymidine kinase 1 (TK1) specific activities compared with those hematological malignancies and blood donors: implications of using serum TK1 as a biomarker

Kiran Kumar Jagarlamudi et al. BMC Cancer. .

Abstract

Background: Thymidine kinase 1 (TK1) is a cellular enzyme involved in DNA precursor synthesis, and its activity has been used as a proliferation marker for monitoring malignant diseases. Here, for the first time, we evaluated both TK1 activity and protein levels in sera from patients with different malignancies.

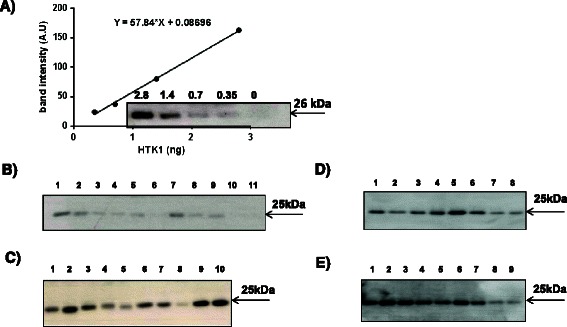
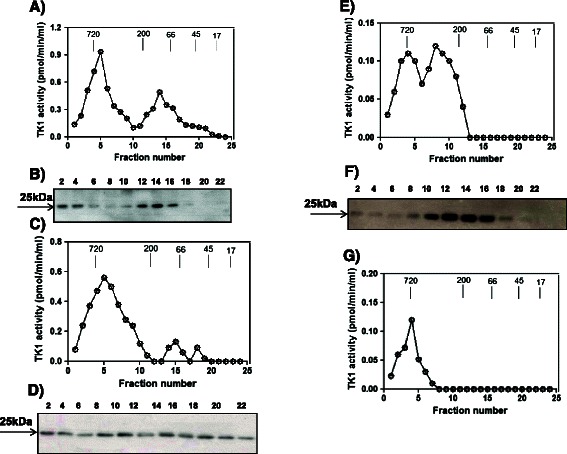
Methods: Serum samples from patients with myelodysplastic syndrome (MDS, n = 22), breast cancer (n = 42), prostate cancer (n = 47) and blood donors (n = 30) were analyzed for TK1 protein and activity levels, using a serum TK1 (STK1) protein assay based on antibodies and an activity assay that measured [(3)H]-deoxythymidine (dThd) phosphorylation. The molecular forms of TK1 in sera from some of these patients were analyzed using size-exclusion chromatography.

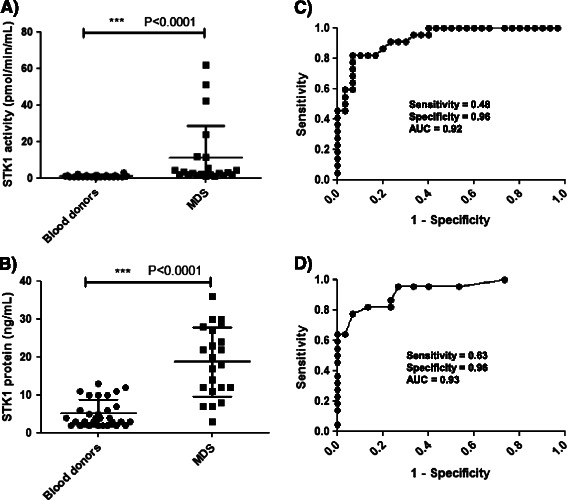
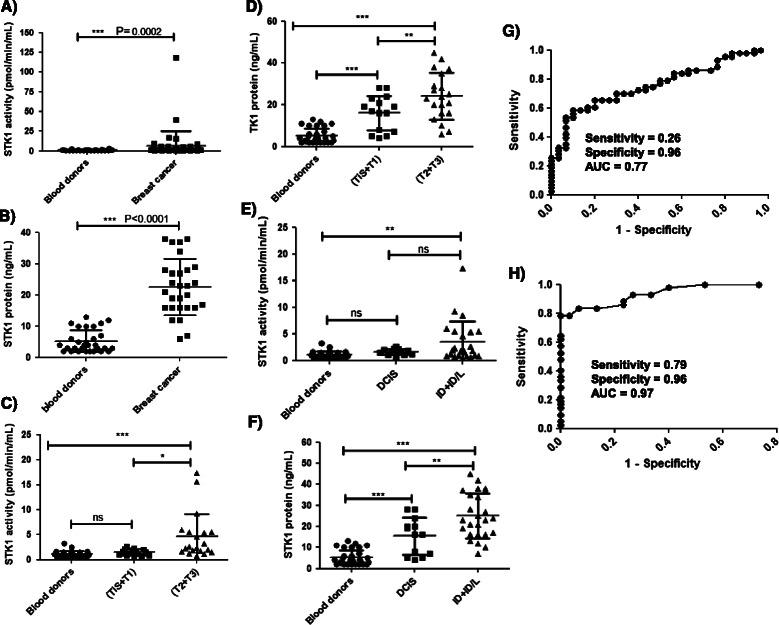
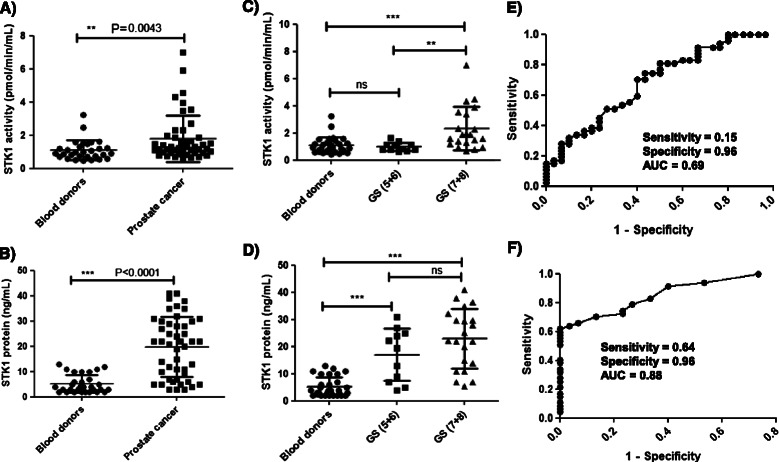
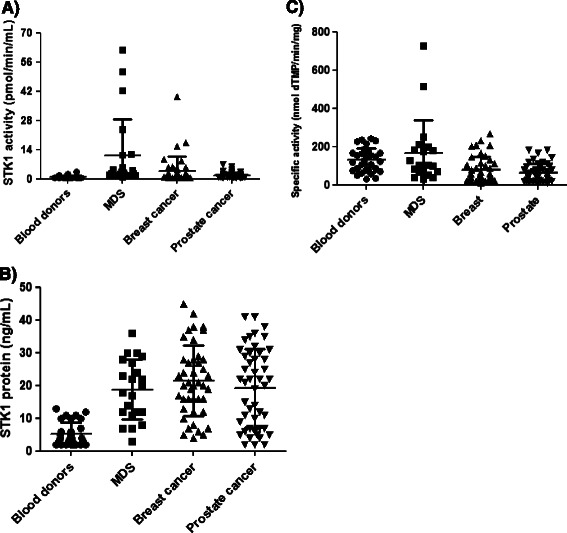
Results: Mean STK1 activities in sera from MDS, breast and prostate cancer were 11 ± 17.5, 6.7 ± 19 and 1.8 ± 1.4 pmol/min/mL, differing significantly from blood donors (mean ± standard deviation (SD) = 1.1 ± 0.9 pmol/min/mL). Serum TK1 protein (25 kDa polypeptide) levels were also significantly higher in MDS, breast, prostate cancer compared to blood donors (mean ± SD = 19 ± 9, 22 ± 11, 20 ± 12, and 5 ± 3.5 ng/mL, respectively). The STK1 specific activities of sera from patients with MDS and blood donors were significantly higher when compared with activities in sera from breast and prostate cancer patients. Size-exclusion analysis of sera from breast and prostate cancer showed that the detected active TK1 was primarily a high molecular weight complex, similar to the forms found in sera from MDS patients and blood donors. However, Western blotting demonstrated high TK1 25 kDa protein levels in fractions lacking TK1 activity in sera from cases with breast and prostate cancer.

Conclusions: These results demonstrate that there are differences in the specific activities and the subunit compositions of STK1 in hematological malignancies compared with breast and prostate cancer. This fact has several important implications for the use of STK1 as a tumor biomarker. One is that STK1 protein assays may differentiate early-stage tumor development in breast and prostate cancer more effectively than STK1 activity assays.


Figures

Figure 1
Figure 1
Immunoaffinity analysis of human recombinant TK1 and serum TK1. (A) Results from the immunoaffinity/Western blotting analysis of purified recombinant human TK1 and the 26 kDa band relative intensity (arbitrary units, A.U.) used as a standard. (B) Examples of results of the immunoaffinity/Western blotting analysis of sera from blood donors, (C) MDS patients, (D) breast cancer, (E) or prostate cancer patients.
Figure 2
Figure 2
TK1 activity and protein levels in sera from MDS patients and blood donors. (A) STK1 activity in sera from blood donors (•) and MDS patients (■). (B) Concentrations of STK1 in sera from blood donors (•) and MDS patients (■). Error bars denote SDs. (C) The receiver operating characteristic (ROC) curve of STK1 activities for discrimination between blood donors and MDS patients. (D) ROC curve analysis of STK1 protein levels in blood donors and MDS patients.
Figure 3
Figure 3
TK1 activity and protein levels in breast cancer patients and blood donors. (A) STK1 activity distributions in sera from blood donors (•) and patients with breast cancer (■). (B) STK1 protein levels in sera from blood donors (•) and patients with breast cancer (■). (C) Comparison of STK1 activities in sera from blood donors (•) and early-stage (TiS + T1; ■) and late-stage (T2 + T3; ▲) breast cancer patients. (D) Comparison of STK1 protein levels in sera from blood donors (•) and early-stage (TiS + T1; ■) and late stage (T2 + T3; ▲) breast cancer patients. (E) Comparison of STK1 activities in blood donors (•) and non-invasive (DCIS; ■) and invasive (ID + ID/L; ▲) breast cancer patients. (F) Comparison of STK1 protein levels in blood donors (•) and non-invasive (DCIS; ■) and invasive (ID + ID/L) breast cancer patients (▲). The error bars denote standard deviations (SDs). (G) Receiver operating characteristic (ROC) curve of STK1 activity in serum samples from breast cancer patients and from blood donors. (H) ROC curve analysis of STK1 protein levels in sera from blood donors and breast cancer patients.
Figure 4
Figure 4
TK1 activity and protein levels in sera from prostate cancer patients and blood donors. (A) STK1 activity in sera from blood donors (•) and prostate cancer patients (■). (B) Concentrations of STK1 in sera from blood donors (•) and prostate cancer patients (■). (C) Comparison of STK1 activity in sera from blood donors (•) and well-differentiated (GS5 + 6; ■) and moderately/poorly differentiated (GS7 + 8; ▲) prostate cancer patients. (D) Comparison of STK1 protein levels in blood donors (•) and well-differentiated (GS5 + 6; ■) and moderately/poorly differentiated (GS7 + 8; ▲) prostate cancer patients. The error bars denote standard deviations (SDs). (E) Receiver operating characteristic (ROC) curve of STK1 activities in sera from prostate cancer patients compared with sera from blood donors. (F) A similar ROC curve analysis of STK1 protein assay results in sera from blood donors and prostate cancer patients.
Figure 5
Figure 5
Serum TK1 activity, STK1 protein levels and STK1 specific activities in different groups. (A) STK1 activities in sera from blood donors (•), MDS (■), breast (▲) and prostate cancer patients (▼). (B) STK1 protein levels in sera from blood donors (•), MDS (■), breast (▲) and prostate cancer patients (▼). (C) Specific activities of TK1 in sera from blood donors (•), MDS (■), breast (▲) and prostate cancer patients (▼).
Figure 6
Figure 6
Molecular forms of serum TK1 analyzed using size-exclusion chromatography. (A) Thymidine kinase 1 activity in serum fractions from an MDS patient. (B) Western blotting analysis of MDS serum fractions using the immunoaffinity method. (C) Thymidine kinase 1 activity in serum fractions from a patient with breast cancer. (D) Western blotting analysis of serum fractions from a patient with breast cancer using the immunoaffinity method. (E) Thymidine kinase 1 activity in serum fractions from a patient with prostate cancer. (F) Western blotting analysis of serum fractions from a prostate cancer patient using the immunoaffinity method. (G) Thymidine kinase 1 activity in fractions from the serum of a blood donor. The numbers denote FPLC fractions. Arrows denote the elution position with respect to molecular weight markers.

References

    1. He Q, Fornander T, Johansson H, Johansson U, Hu GZ, Rutqvis LE, et al. Thymidine kinase 1 in serum predicts increased risk of distant or loco-regional recurrence following surgery in patients with early breast cancer. Anti Cancer Res. 2006;26:4753–9. - PubMed
    1. Eriksson S, Munch-Petersen B, Johansson K, Eklund H. Structure and function of cellular deoxyribonucleoside kinases. Cell Mol Life Sci. 2002;59:1327–46. doi: 10.1007/s00018-002-8511-x. - DOI - PMC - PubMed
    1. He Q, Skog S, Tribukait B. Cell cycle related studies on thymidine kinase and its isoenzymes in Ehrlich ascites tumours. Cell Prolif. 1991;24:3–14. doi: 10.1111/j.1365-2184.1991.tb01506.x. - DOI - PubMed
    1. Gasparri F, Wang N, Skog S, Galvani A, Eriksson S. Thymidine kinase 1 expression defines an activated G1 state of the cell cycle as revealed with site-specific antibodies and ArrayScan (TM) assays. Eur J Cell Biol. 2009;88:779–85. doi: 10.1016/j.ejcb.2009.06.005. - DOI - PubMed
    1. Ke PY, Chang ZF. Mitotic degradation of human thymidine kinase 1 is dependent on the anaphase-promoting complex/cyclosome-Cdh1-mediated pathway. Mol Cell Biol. 2004;24:514–26. doi: 10.1128/MCB.24.2.514-526.2004. - DOI - PMC - PubMed

Publication types

MeSH terms