. 2015 Apr 15;16(1):298.
doi: 10.1186/s12864-015-1494-4.

De novo transcriptome assembly of the wild relative of tea tree (Camellia taliensis) and comparative analysis with tea transcriptome identified putative genes associated with tea quality and stress response

Affiliations

De novo transcriptome assembly of the wild relative of tea tree (Camellia taliensis) and comparative analysis with tea transcriptome identified putative genes associated with tea quality and stress response

Hai-Bin Zhang et al. BMC Genomics. .

Abstract

Background: Camellia taliensis is one of the most important wild relatives of cultivated tea tree, C. sinensis. The species extensively occupies mountainous habitats representing a wide-range abiotic tolerance and biotic resistance and thus harbors valuable gene resources that may greatly benefit genetic improvement of cultivated tea tree. However, owning to a large genome size of ~3 Gb and structurally complex genome, there are fairly limited genetic information and particularly few genomic resources publicly available for this species. To better understand the key pathways determining tea flavor and enhance tea tree breeding programs, we performed a high-throughput transcriptome sequencing for C. taliensis.

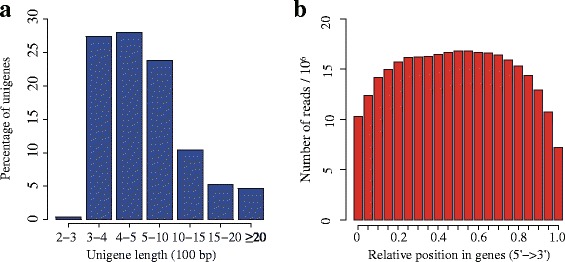
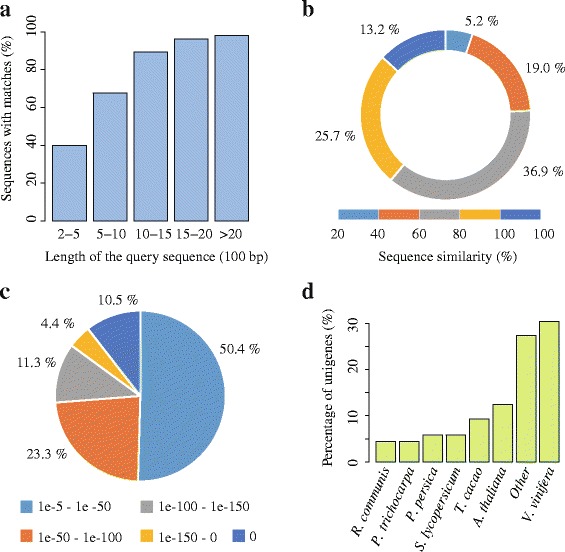
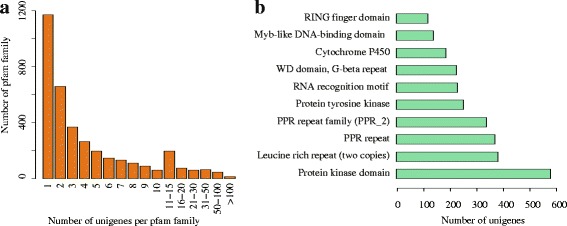
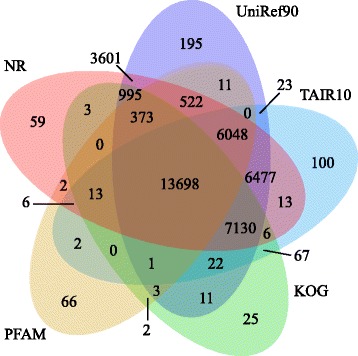
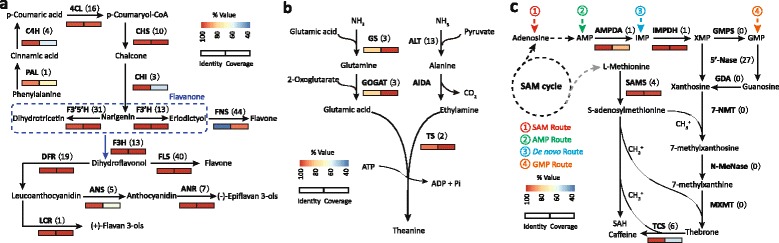
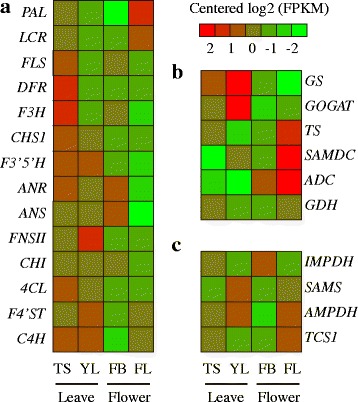
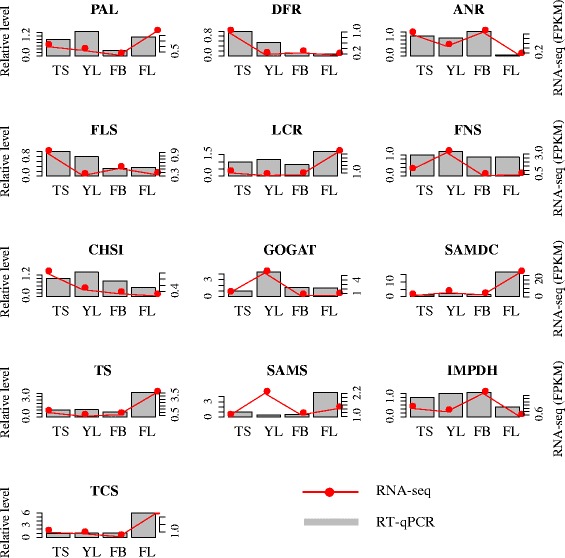
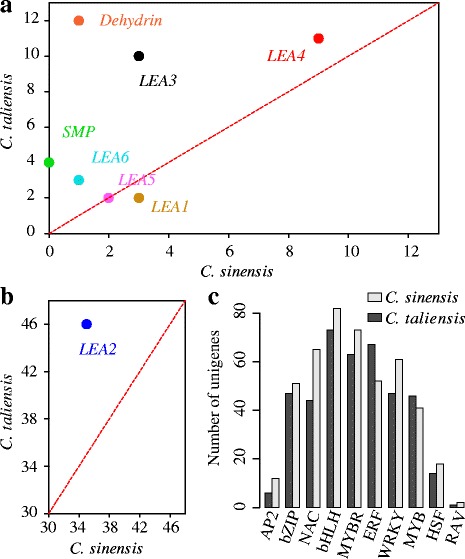
Results: In this study, approximate 241.5 million high-quality paired-end reads, accounting for ~24 Gb of sequence data, were generated from tender shoots, young leaves, flower buds and flowers using Illumina HiSeq 2000 platform. De novo assembly with further processing and filtering yielded a set of 67,923 transcripts with an average length of 685 bp and an N50 of 995 bp. Based on sequence similarity searches against public databases, a total of 39,475 transcripts were annotated with gene descriptions, conserved protein domains or gene ontology (GO) terms. Candidate genes for major metabolic pathways involved in tea quality were identified and experimentally validated using RT-qPCR. Further gene expression profiles showed that they are differentially regulated at different developmental stages. To gain insights into the evolution of these genes, we aligned them to the previously cloned orthologous genes in C. sinensis, and found that considerable nucleotide variation within several genes involved in important secondary metabolic biosynthesis pathways, of which flavone synthase II gene (FNSII) is the most variable between these two species. Moreover, comparative analyses revealed that C. taliensis shows a remarkable expansion of LEA genes, compared to C. sinensis, which might contribute to the observed stronger stress resistance of C. taliensis.

Conclusion: We reported the first large-coverage transcriptome datasets for C. taliensis using the next-generation sequencing technology. Such comprehensive EST datasets provide an unprecedented opportunity for identifying genes involved in several major metabolic pathways and will accelerate functional genomic studies and genetic improvement efforts of tea trees in the future.


Figures

Figure 1
Figure 1
Summary of the C. taliensis transcriptome assembly. (a) Size distribution of the assembled unigenes. (b) Random distribution of the sequencing reads in the unigenes. The x-axis indicates the relative position in the unigenes. The orientation is from 5’ end to 3’ end.
Figure 2
Figure 2
Characteristics of the homology search of unigenes against the NR database. (a) Effects of query sequence length on percentage of significant matches. The cut-off value was set at 1.0e-5. The proportion of sequences with matches in the NR database at NCBI is greater among the longer assembled sequences. (b) Similarity distribution of the best BLAST hits for each unigene. (c) E-value distribution of the top BLAST hits for each unigene. (d) Species distribution is shown as the percentage of the total homologous sequences.
Figure 3
Figure 3
Protein families in C. taliensis transcriptome. (a) The number of Pfam domains/families versus the occurrence of C. taliensis transcripts contained in each domain/family. (b) The 10 most abundant protein families in C. taliensis.
Figure 4
Figure 4
Venn diagram showing the BLAST results of C. taliensis transcriptome against five databases. De novo reconstructed transcript sequences were used to search against public databases including NR, UniRef90, TAIR10, KOG and PFAM. The number of transcripts that have significant hits against the five databases is shown in each intersection of the Venn diagram.
Figure 5
Figure 5
Unigenes involved in the three metabolic pathways. The number in parenthesis means the number of unigenes identified in C. taliensis, and the color bar represents the identity and coverage of the best unigene (Additional file 5) detected in C. taliensis against its corresponding gene in C. sinensis. a) Flavonoids biosynthesis pathway. b) Theanine biosynthesis pathway. c) Caffeine biosynthesis pathway.
Figure 6
Figure 6
Expression pattern of candidate genes involved in different biosynthesis pathways. a) Flavonoids biosynthesis pathway. b) Theanine biosynthesis pathway. c) Caffeine biosynthesis pathway. (TS: tender shoots; YL: young leaves; FB: flower bud; FL: flower).
Figure 7
Figure 7
Quantitative RT-qPCR validations. A total of 13 genes were selected for the quantitative RT-qPCR experiments. Of them, PAL, DFR, ANR, FLS, LCR, FNS and CHSI were for flavonoids biosynthesis pathway, GOGAT, SAMDC and TS belong to theanine biosynthesis pathway, and SAMS, IMPDH and TCS were from caffeine biosynthesis pathway.
Figure 8
Figure 8
Comparative analysis of stress resistance related genes between C. taliensis and C. sinensis transcriptome. a) The members of LEA family identified in C. taliensis and C. sinensis. The y-axes represent the numbers of LEA members found in C. taliensis, while x-axes shows the number identified in C. sinensis. Red dashed line means the number of LEA members that are equivalent in these two species. b) The largest LEA family identified in C. taliensis and C. sinensis. c) The number of cold tolerance related TFs identified from C. taliensis and C. sinensis.

References

    1. Ming TL. A revision of Camellia Section Thea. Acta Botanica Yunnanica. 1992;14(2):116–32.
    1. Takeda Y. Cross compatibility of tea (Camellia sinensis) and its allied species in the genus Camellia. Jpn Agri Res Quar. 1990;24(14):111–6.
    1. Zhang J, Wang PS, Chen HW, Yi B. Wild tea populations in Shuangjiang Mengku of Yunnan Province. J Tea. 2003;29(4):220–1.
    1. Shi CY, Yang H, Wei CL, Yu O, Zhang ZZ, Jiang CJ, et al. Deep sequencing of the C. sinensis transcriptome revealed candidate genes for major metabolic pathways of tea-specific compounds. BMC Genomics. 2011;12(1):131. doi: 10.1186/1471-2164-12-131. - DOI - PMC - PubMed
    1. Wang XC, Zhao QY, Ma CL, Zhang ZH, Cao HL, Kong YM, et al. Global transcriptome profiles of C. sinensis during cold acclimation. BMC Genomics. 2013;14(1):415. doi: 10.1186/1471-2164-14-415. - DOI - PMC - PubMed

Publication types

MeSH terms

Associated data

LinkOut - more resources