

Associations between breast density and a panel of single nucleotide polymorphisms linked to breast cancer risk: a cohort study with digital mammography
- PMID: 25881232
- PMCID: PMC4365961
- DOI: 10.1186/s12885-015-1159-3
Associations between breast density and a panel of single nucleotide polymorphisms linked to breast cancer risk: a cohort study with digital mammography
Abstract
Background: Breast density and single-nucleotide polymorphisms (SNPs) have both been associated with breast cancer risk. To determine the extent to which these two breast cancer risk factors are associated, we investigate the association between a panel of validated SNPs related to breast cancer and quantitative measures of mammographic density in a cohort of Caucasian and African-American women.
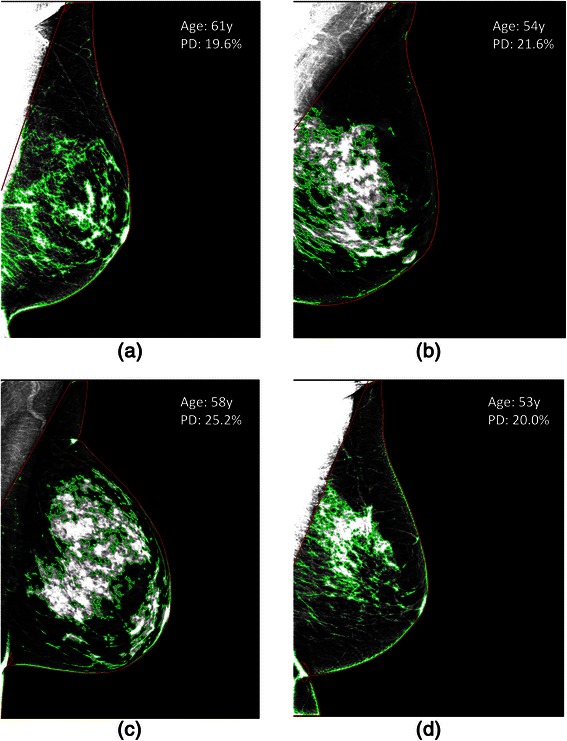
Methods: In this IRB-approved, HIPAA-compliant study, we analyzed a screening population of 639 women (250 African American and 389 Caucasian) who were tested with a validated panel assay of 12 SNPs previously associated to breast cancer risk. Each woman underwent digital mammography as part of routine screening and all were interpreted as negative. Both absolute and percent estimates of area and volumetric density were quantified on a per-woman basis using validated software. Associations between the number of risk alleles in each SNP and the density measures were assessed through a race-stratified linear regression analysis, adjusted for age, BMI, and Gail lifetime risk.
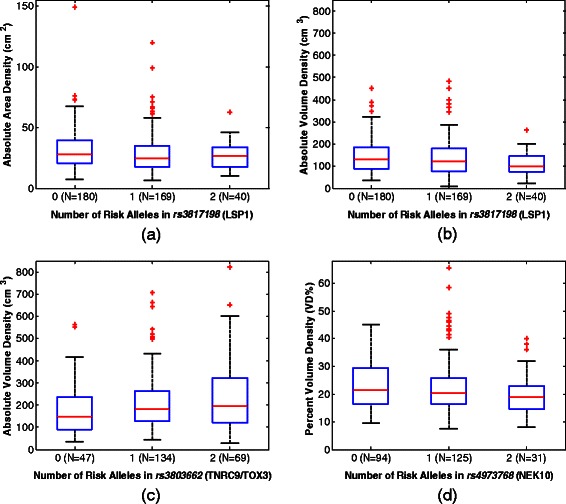
Results: The majority of SNPs were not found to be associated with any measure of breast density. SNP rs3817198 (in LSP1) was significantly associated with both absolute area (p = 0.004) and volumetric (p = 0.019) breast density in Caucasian women. In African-American women, SNPs rs3803662 (in TNRC9/TOX3) and rs4973768 (in NEK10) were significantly associated with absolute (p = 0.042) and percent (p = 0.028) volume density respectively.
Conclusions: The majority of SNPs investigated in our study were not found to be significantly associated with breast density, even when accounting for age, BMI, and Gail risk, suggesting that these two different risk factors contain potentially independent information regarding a woman's risk to develop breast cancer. Additionally, the few statistically significant associations between breast density and SNPs were different for Caucasian versus African American women. Larger prospective studies are warranted to validate our findings and determine potential implications for breast cancer risk assessment.
Figures
References
-
- Vacek PM, Geller BM. A prospective study of breast cancer risk using routine mammographic breast density measurements. Cancer Epidemiol Biomarkers Prev. 2004;13(5):715–22. - PubMed
Publication types
MeSH terms
Grants and funding
LinkOut - more resources
Full Text Sources
Other Literature Sources
Medical
Miscellaneous
