. 2015 Mar 12:8:11.
doi: 10.1186/s12920-015-0086-0.

Integrative analysis of survival-associated gene sets in breast cancer

Affiliations

Integrative analysis of survival-associated gene sets in breast cancer

Frederick S Varn et al. BMC Med Genomics. .

Abstract

Background: Patient gene expression information has recently become a clinical feature used to evaluate breast cancer prognosis. The emergence of prognostic gene sets that take advantage of these data has led to a rich library of information that can be used to characterize the molecular nature of a patient's cancer. Identifying robust gene sets that are consistently predictive of a patient's clinical outcome has become one of the main challenges in the field.

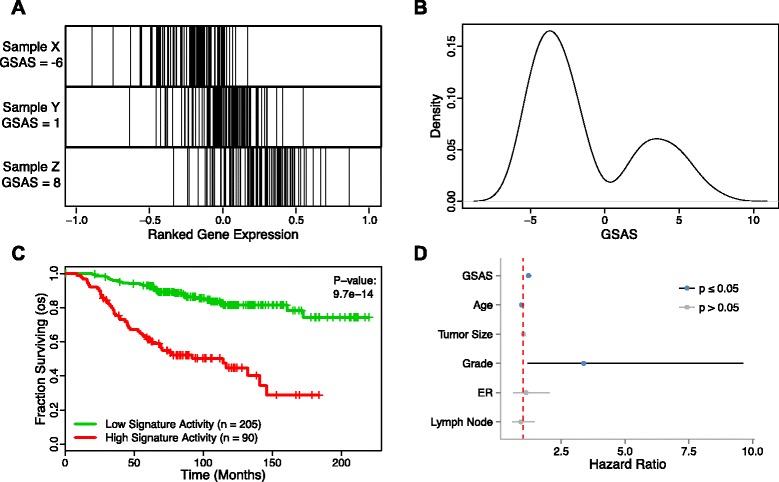
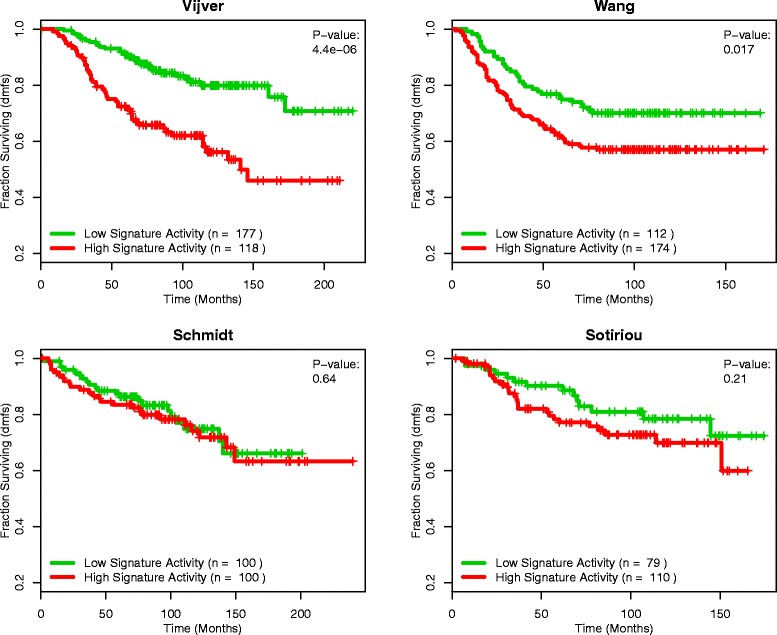
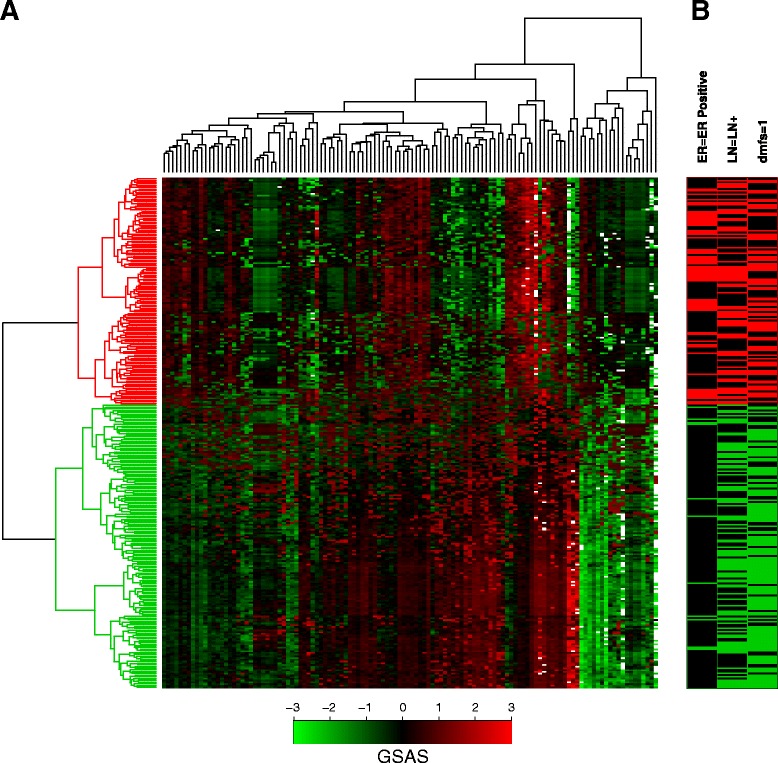
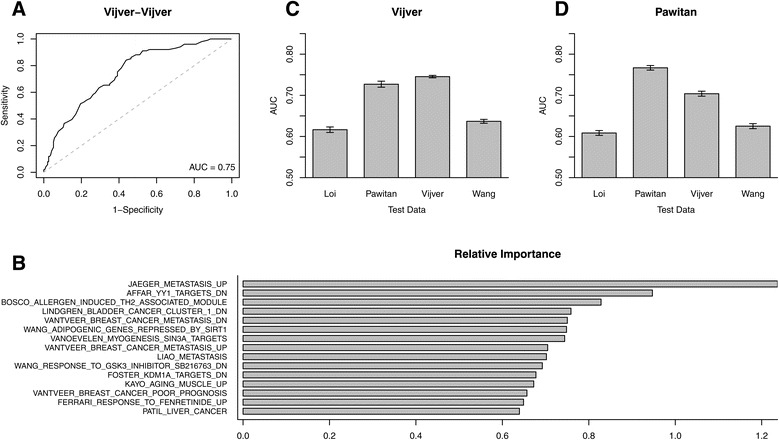
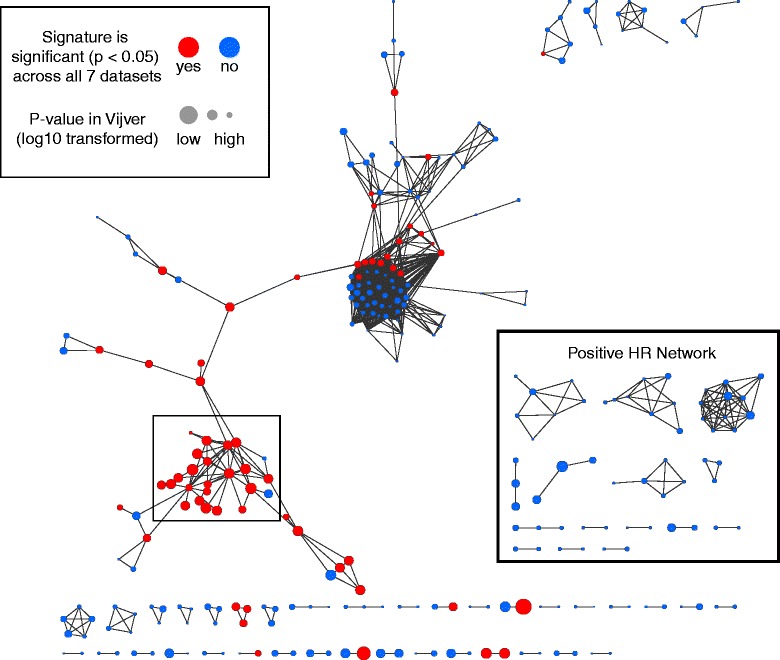
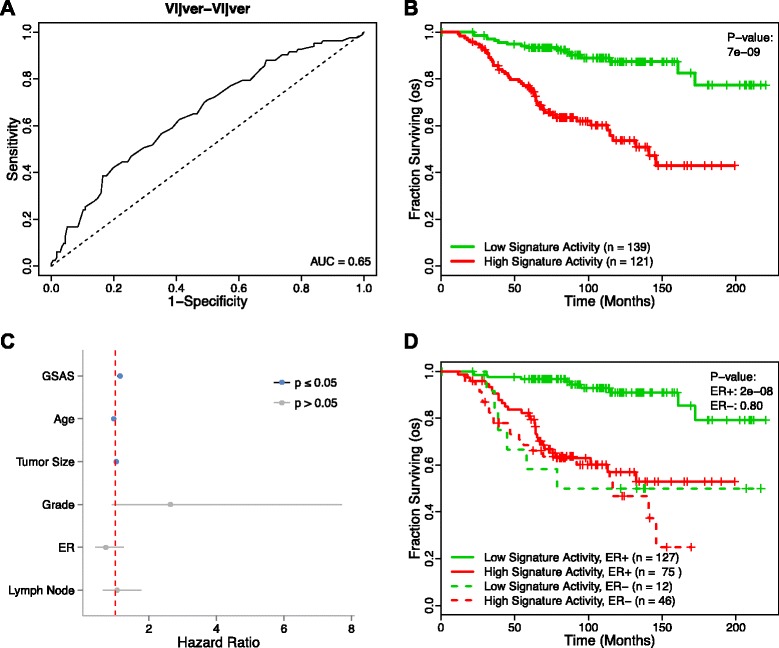
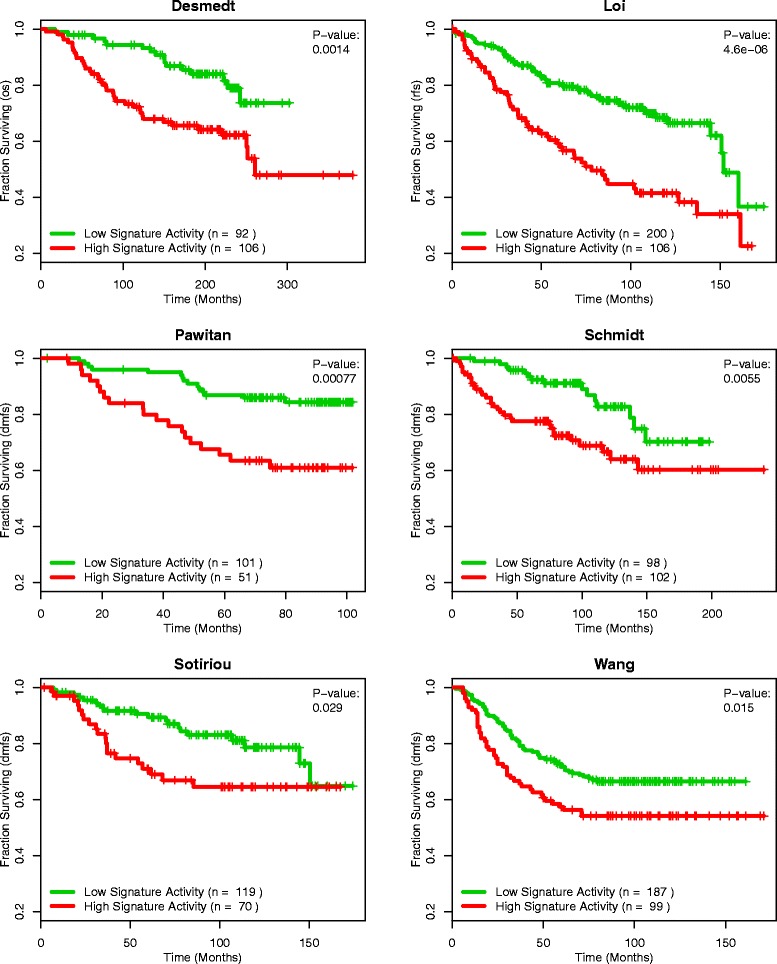
Methods: We inputted our previously established BASE algorithm with patient gene expression data and gene sets from MSigDB to develop the gene set activity score (GSAS), a metric that quantitatively assesses a gene set's activity level in a given patient. We utilized this metric, along with patient time-to-event data, to perform survival analyses to identify the gene sets that were significantly correlated with patient survival. We then performed cross-dataset analyses to identify robust prognostic gene sets and to classify patients by metastasis status. Additionally, we created a gene set network based on component gene overlap to explore the relationship between gene sets derived from MSigDB. We developed a novel gene set based on this network's topology and applied the GSAS metric to characterize its role in patient survival.

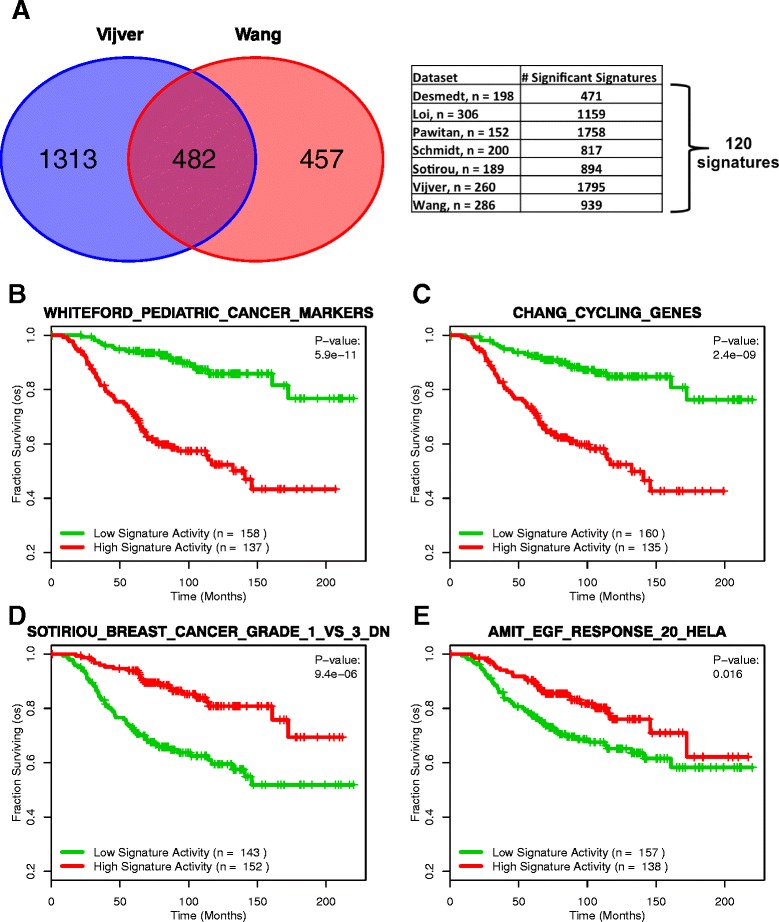
Results: Using the GSAS metric, we identified 120 gene sets that were significantly associated with patient survival in all datasets tested. The gene overlap network analysis yielded a novel gene set enriched in genes shared by the robustly predictive gene sets. This gene set was highly correlated to patient survival when used alone. Most interestingly, removal of the genes in this gene set from the gene pool on MSigDB resulted in a large reduction in the number of predictive gene sets, suggesting a prominent role for these genes in breast cancer progression.

Conclusions: The GSAS metric provided a useful medium by which we systematically investigated how gene sets from MSigDB relate to breast cancer patient survival. We used this metric to identify predictive gene sets and to construct a novel gene set containing genes heavily involved in cancer progression.


Figures

Figure 1
Figure 1
The GSAS of VANTVEER_BREAST_CANCER_METASTASIS_DN predicts patient survival. (A) The distribution of genes from this gene set in an expression-ranked gene list in samples with a low (Sample X), intermediate (Sample Y), and high (Sample Z) GSAS. (B) The distribution of GSASs across all samples in a dataset. (C) Patients with positive GSASs (red curve) show significantly shorter survival times than those with negative GSASs (green curve). Vertical hash marks indicate points of censored data. (D) In a Cox PH model, this GSAS significantly predicts patient survival even after adjusting for traditional clinical features. A red dotted line indicates where the hazard ratio = 1.
Figure 2
Figure 2
KARAKAS_TGFB1_SIGNALING as a predictor of survival in four datasets. Patients with positive GSASs (red curve) versus negative GSASs (green curve) for the gene set KARAKAS_TGFB1_SIGNALING in four different datasets. The GSASs for this gene set are significantly predictive of survival in the van de Vijver and Wang datasets (p < 0.05), however when applied to the Schmidt and Sotiriou datasets, the GSASs for this gene set are no longer significant (p > 0.1).
Figure 3
Figure 3
Expansion of analysis to 7 datasets yields 120 robust signatures. (A) Overlap analysis of gene sets significantly correlated with survival across seven datasets (p < 0.05) reveals 120 “robust” gene sets. (B) A gene signature containing genes that are differentially expressed between pediatric tumors and normal tissue. (C) A gene signature whose genes are associated with periodic cell cycle expression. (D) A gene signature whose genes are associated with histologic grade. (E) A gene signature containing genes stimulated by EGF in HeLa cells. (B-E) are examples of the 120 robust gene sets. In (B) and (C), high signature activity has a protective effect (hr < 1), while in (D) and (E) high signature activity has a deleterious effect (hr > 1).
Figure 4
Figure 4
Hierarchical clustering of samples using the GSASs for the 120 robust gene sets. (A) A heatmap showing the pattern of GSASs for the 120 robust gene sets across the 295 samples in the van de Vijver dataset. Each row represents one sample’s GSAS profile for each of the 120 robust gene sets and each column represents the GSASs across all samples for one of the robust gene sets. To show contrast, all GSASs less than −3 or greater than 3 were adjusted to −3 and 3, respectively. Green is indicative of a lower (more negative) GSAS for a sample while red is indicative of a higher (more positive) GSAS for a sample. (B) Hierarchical clustering of the samples based on GSAS in the robust gene sets reveals two distinct groups of samples. The red group is enriched in samples with ER- breast cancer and distant metastasis occurrence compared to the green group.
Figure 5
Figure 5
Metastasis prediction performance using GSAS. (A) A receiver operating characteristic (ROC) curve for the Random Forest classification of metastatic versus non-metastatic samples in the van de Vijver dataset using GSASs that significantly differed between metastatic and non-metastatic samples in the van de Vijver dataset (Wilcoxon rank-sum test, FDR < 0.01) as the training data. (B) The relative importance values assigned by the Random Forest classifier used in (A) to each gene set when classifying samples. (C, D) AUC scores for the Random Forest classification of metastatic versus non-metastatic samples in different datasets when using GSASs that significantly differed between metastatic and non-metastatic samples in van de Vijver (C) and Pawitan (D) as the training data.
Figure 6
Figure 6
A gene set network reveals a module highly enriched in cell proliferation genes. Gene sets significantly associated with survival (FDR < 0.01) in the van de Vijver dataset were selected and dichotomized based on having a negative effect hazard ratio (hr ≥ 1.00) or a positive effect hazard ratio (hr < 1.00). A network was then created from the two groups of genes linking the gene sets (nodes) by the number of genes they had in common (edges). This analysis revealed a module (solid box) made up of the robust gene sets whose genes were enriched in cell proliferative-based functions.
Figure 7
Figure 7
Performance of the core gene set in classification and survival analysis. (A) A receiver operating characteristic (ROC) curve for the Random Forest classification of metastatic versus non-metastatic samples in the van de Vijver dataset using the genes of the core gene set whose expression significantly differed between metastatic and non-metastatic samples in the van de Vijver dataset (Wilcoxon rank-sum, FDR < 0.01) as the features. (B) Patients from the van de Vijver dataset with a positive GSAS for the core gene set (red curve) show significantly shorter survival times than those with a negative GSAS (green curve). Vertical hash marks indicate points of censored data. (C) In a Cox PH model, the GSAS for the core gene set significantly predicts patient survival even after adjusting for traditional clinical features. (D) The core gene set is effective in predicting patient survival in ER+ samples but not in ER- samples.
Figure 8
Figure 8
Survival analysis of the core gene set across datasets. Across all datasets, patients with positive core gene set GSASs (red curve) show shorter survival times than those with negative core gene set GSASs (green curve) (all p-values <0.05). Vertical hash marks indicate points of censored data.

References

    1. Liotta L, Petricoin E. Molecular profiling of human cancer. Nat Rev Genet. 2000;1:48–56. doi: 10.1038/35049567. - DOI - PubMed
    1. van ’t Veer LJ, Dai H, van de Vijver MJ, He YD, Hart AA, Mao M, et al. Gene expression profiling predicts clinical outcome of breast cancer. Nature. 2002;415:530–6. doi: 10.1038/415530a. - DOI - PubMed
    1. Paik S, Shak S, Tang G, Kim C, Baker J, Cronin M, et al. A multigene assay to predict recurrence of tamoxifen-treated, node-negative breast cancer. N Engl J Med. 2004;351:2817–26. doi: 10.1056/NEJMoa041588. - DOI - PubMed
    1. Ma XJ, Wang Z, Ryan PD, Isakoff SJ, Barmettler A, Fuller A, et al. A two-gene expression ratio predicts clinical outcome in breast cancer patients treated with tamoxifen. Cancer Cell. 2004;5:607–16. doi: 10.1016/j.ccr.2004.05.015. - DOI - PubMed
    1. Rhodes DR, Yu J, Shanker K, Deshpande N, Varambally R, Ghosh D, et al. Large-scale meta-analysis of cancer microarray data identifies common transcriptional profiles of neoplastic transformation and progression. Proc Natl Acad Sci U S A. 2004;101:9309–14. doi: 10.1073/pnas.0401994101. - DOI - PMC - PubMed

Publication types