

Multiple risk factors predict recurrence of major depressive disorder in women
- PMID: 25881281
- PMCID: PMC4504430
- DOI: 10.1016/j.jad.2015.03.045
Multiple risk factors predict recurrence of major depressive disorder in women
Abstract
Background: It is difficult to predict recurrence of depressive episodes in patients with major depression (MD): evidence for many risk factors is inconsistent and general prediction algorithms are lacking. The aim of this study was to develop a prediction model for recurrence of depressive episodes in women using improved methodology.
Methods: We used prospective data from a general population sample of female twins with a last-year MD episode (n=194). A rich set of baseline predictors was analyzed with Cox proportional hazards regression subject to elastic net regularization to find a model predicting recurrence of depressive episodes. Prediction accuracy of the model was assessed in an independent test sample (n=133), which was limited by the unavailability of a number of key predictors.
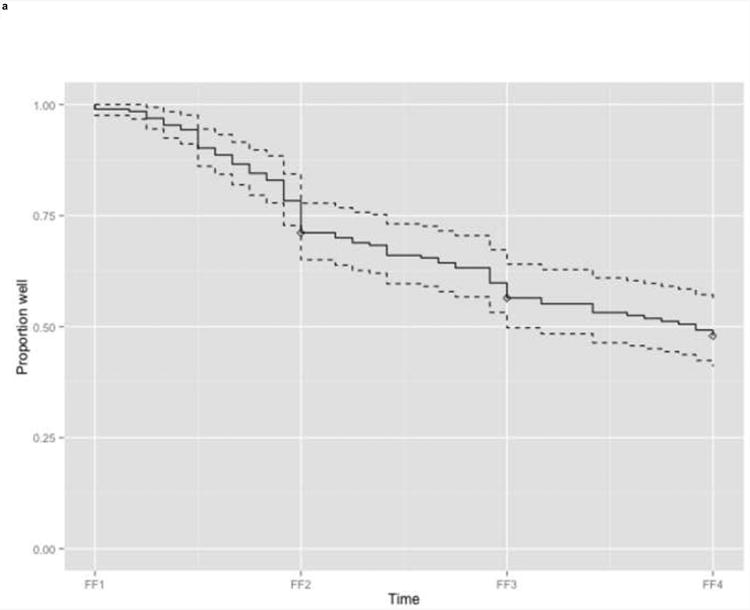
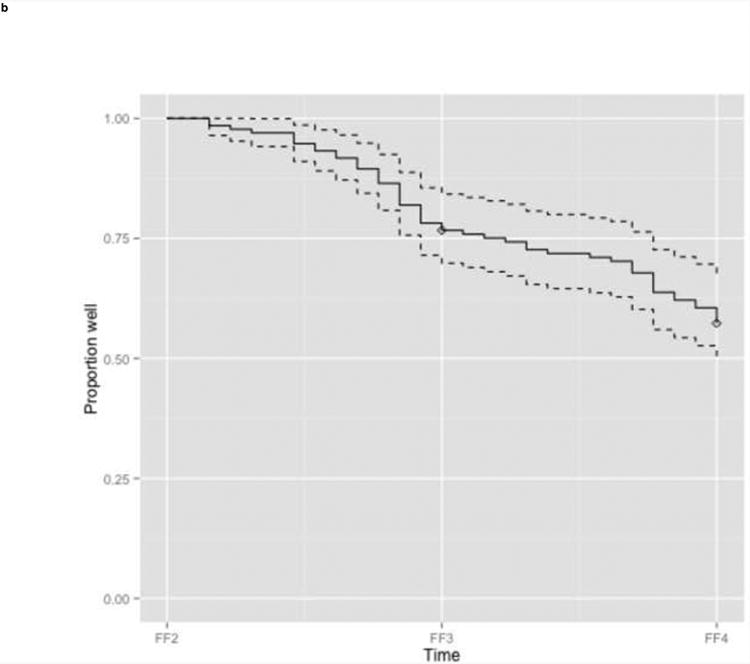
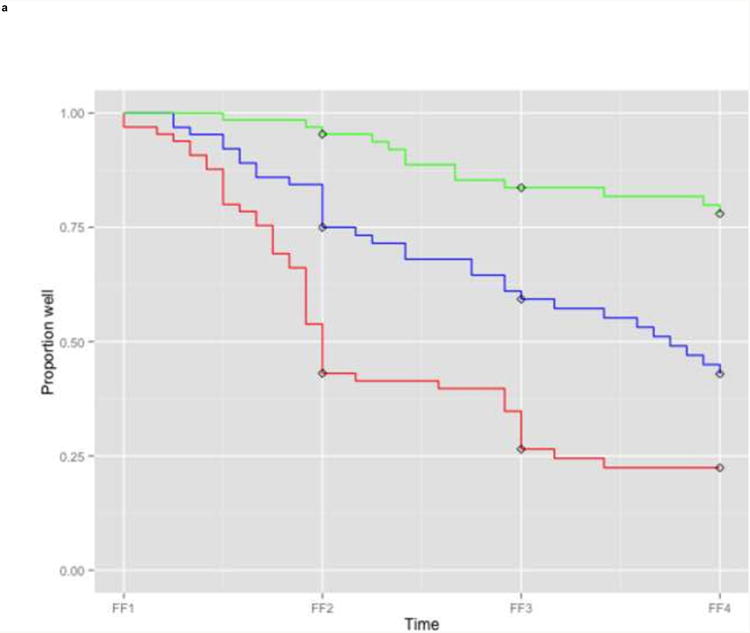
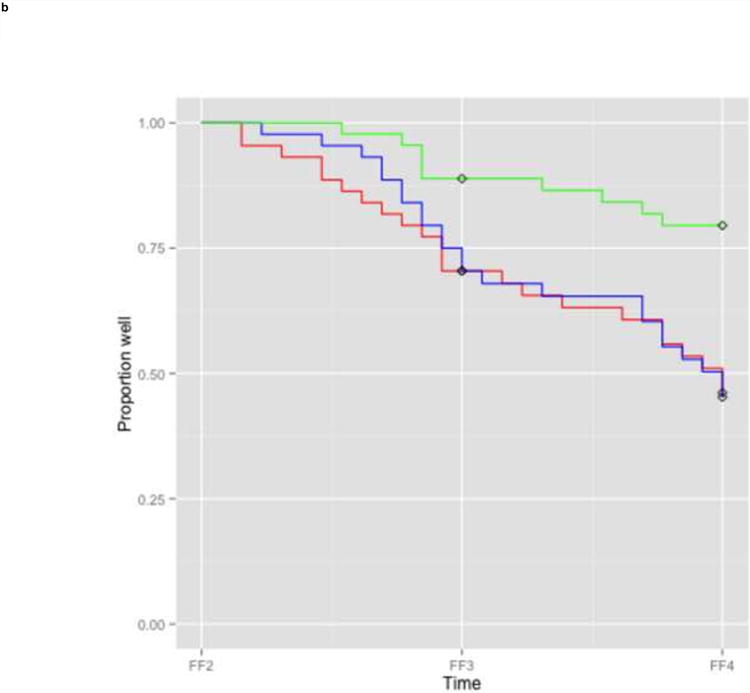
Results: A wide variety of risk factors predicted recurrence of depressive episodes in women: depressive and anxiety symptoms during the index episode, the level of symptoms at the moment of interview, psychiatric and family history, early and recent adverse life events, being unmarried, and problems with friends and finances. Kaplan Meier estimated survival curves showed that the model differentiated between patients at higher and lower risk for recurrence; estimated areas under the curve were in the range of 0.61-0.79.
Limitations: Despite our rich set of predictors, certain potentially relevant variables were not available, such as biological measures, chronic somatic diseases, and treatment status.
Conclusions: Recurrence of episodes of MD in women is highly multifactorial. Future studies should take this into account for the development of clinically useful prediction algorithms.
Keywords: Major depressive disorder; Prediction; Recurrence; Women.
Copyright © 2015 Elsevier B.V. All rights reserved.
Conflict of interest statement
Figures
References
-
- American Psychiatric Association. Diagnostic and Statistical Manual of Mental Disorders: DSM-lll-R. Press Syndicate of the University of Cambridge; Cambridge: 1987.
-
- Antman EM, Cohen M, Bernink PJ, McCabe CH, Horacek T, Papuchis G, Mautner B, Corbalan R, Radley D, Braunwald E. The TIMI risk score for unstable angina/non-ST elevation Ml: A method for prognostication and therapeutic decision making. JAMA. 2000;284:835–842. - PubMed
-
- Boschloo L, Schoevers RA, Beekman AT, Smit JH, van Hemert AM, Penninx BW. The four-year course of major depressive disorder: the role of staging and risk factor determination. Psychother Psychosom. 2014;83:279–288. - PubMed
-
- Cumming G. Replication and p intervals: p values predict the future only vaguely, but confidence intervals do much better. Perspectives on Psychological Science. 2008;3:286–300. - PubMed
-
- Derogatis LR, Lipman RS, Covi L. SCL-90: an outpatient psychiatric rating scale-preliminary report. Psychopharmacol Bull. 1973;9:13–28. - PubMed
Publication types
MeSH terms
Grants and funding
LinkOut - more resources
Full Text Sources
Other Literature Sources
Medical
