. 2015 Jun 12;290(24):14963-78.
doi: 10.1074/jbc.M114.627794. Epub 2015 Apr 16.

Target of Rapamycin Complex 2 Regulates Actin Polarization and Endocytosis via Multiple Pathways

Affiliations

Target of Rapamycin Complex 2 Regulates Actin Polarization and Endocytosis via Multiple Pathways

Delphine Rispal et al. J Biol Chem. .

Abstract

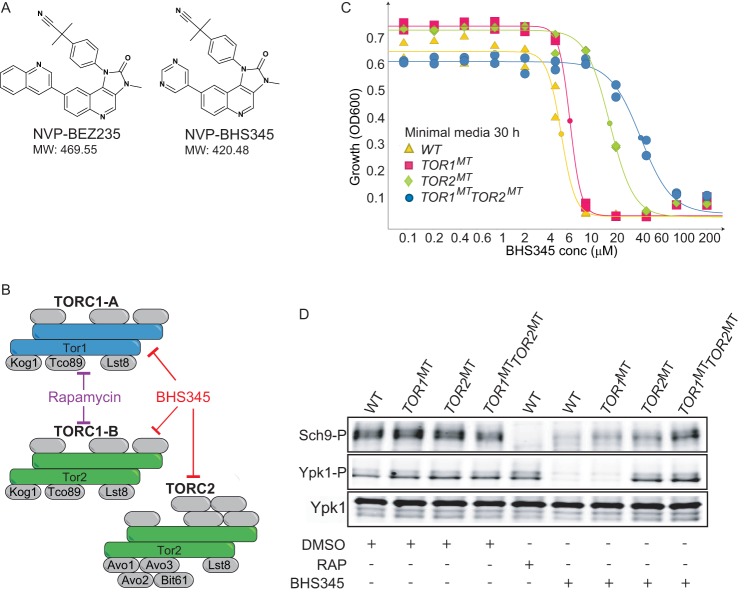
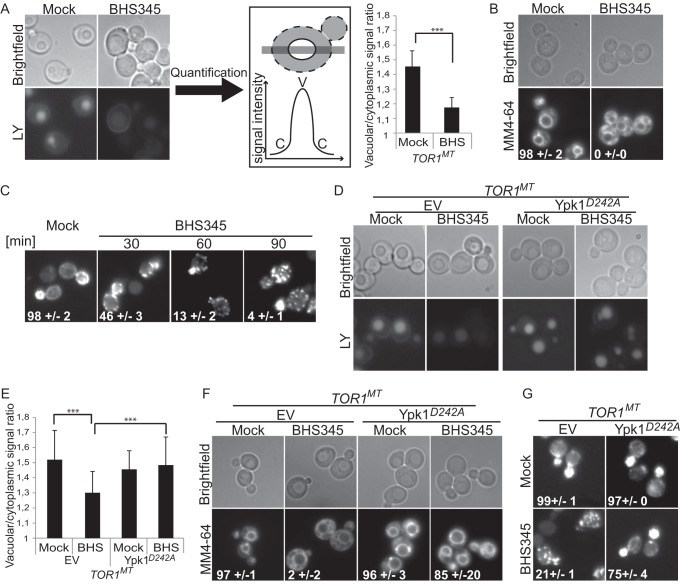
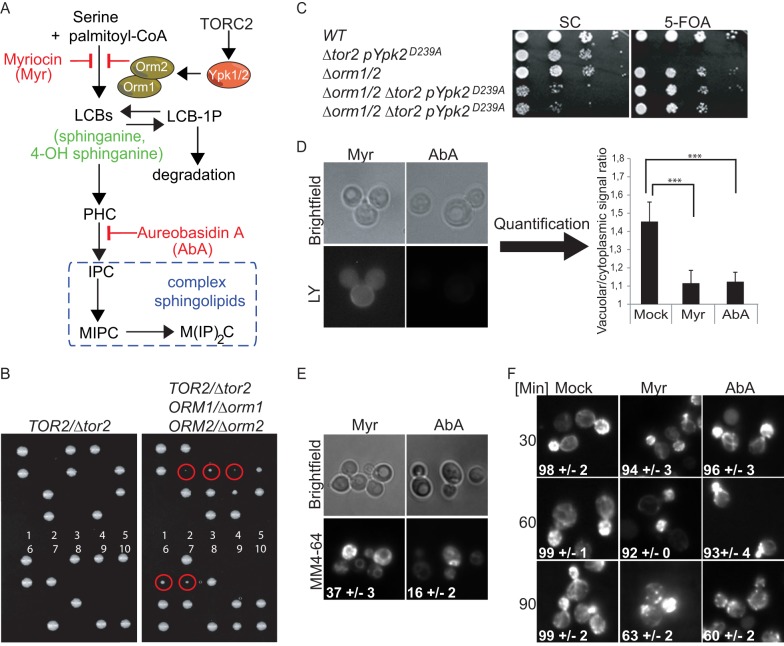
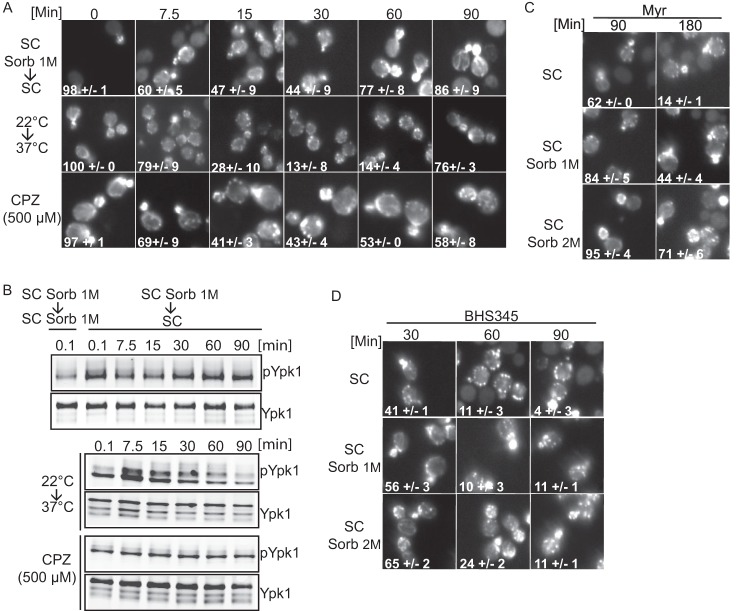
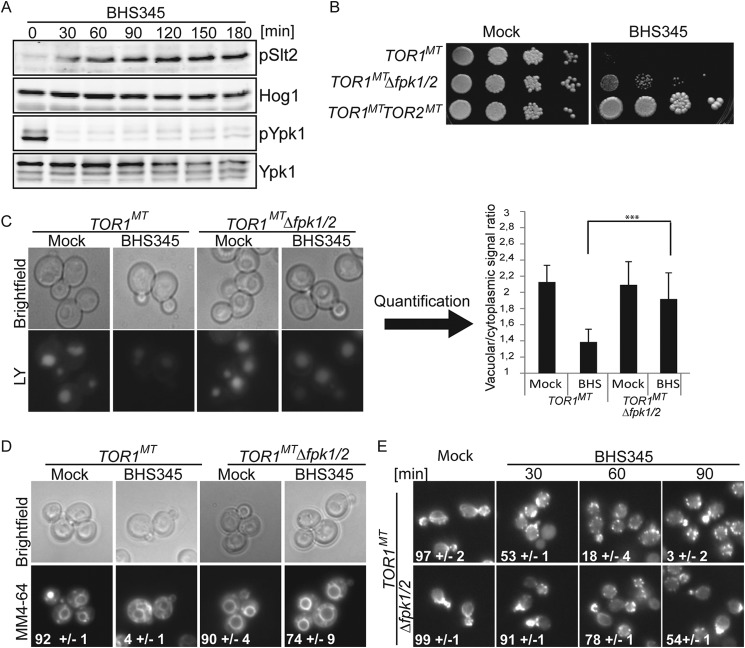
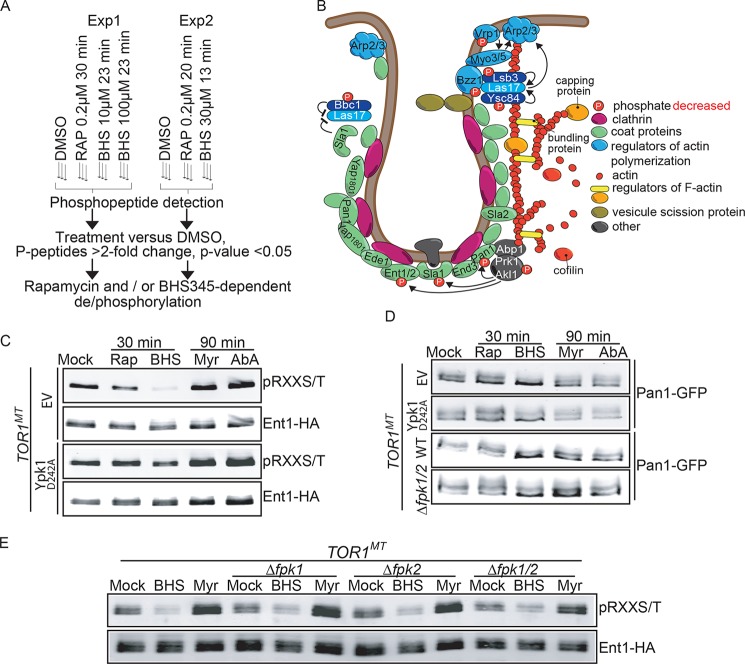
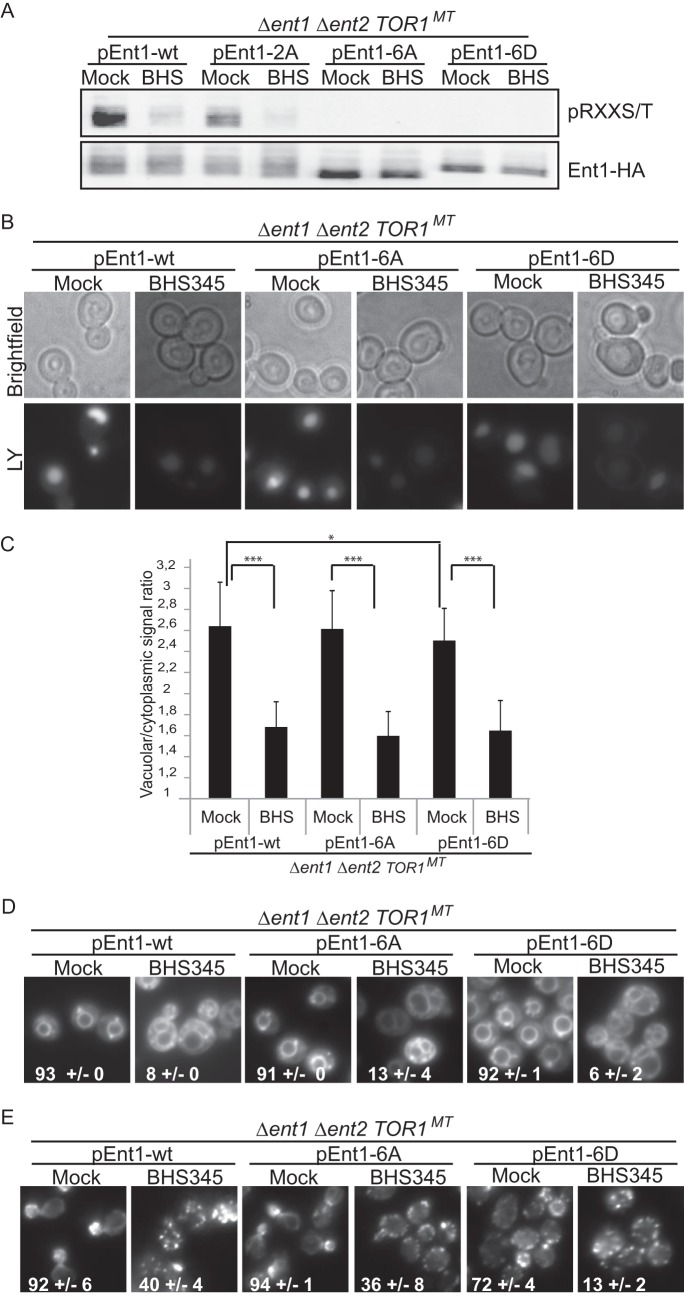
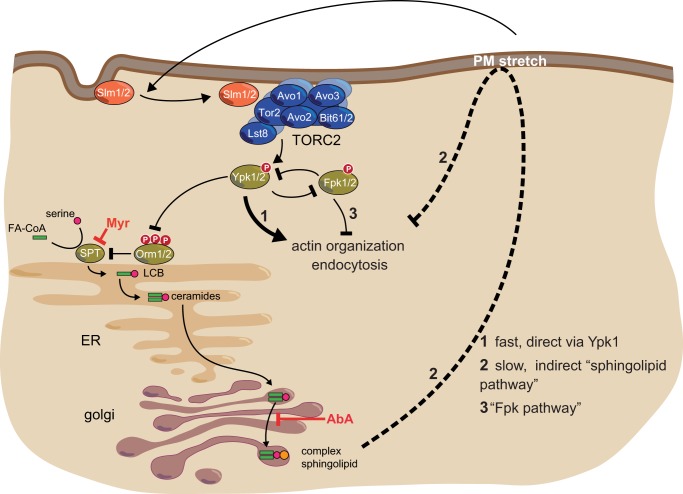
Target of rapamycin is a Ser/Thr kinase that operates in two conserved multiprotein complexes, TORC1 and TORC2. Unlike TORC1, TORC2 is insensitive to rapamycin, and its functional characterization is less advanced. Previous genetic studies demonstrated that TORC2 depletion leads to loss of actin polarization and loss of endocytosis. To determine how TORC2 regulates these readouts, we engineered a yeast strain in which TORC2 can be specifically and acutely inhibited by the imidazoquinoline NVP-BHS345. Kinetic analyses following inhibition of TORC2, supported with quantitative phosphoproteomics, revealed that TORC2 regulates these readouts via distinct pathways as follows: rapidly through direct protein phosphorylation cascades and slowly through indirect changes in the tensile properties of the plasma membrane. The rapid signaling events are mediated in large part through the phospholipid flippase kinases Fpk1 and Fpk2, whereas the slow signaling pathway involves increased plasma membrane tension resulting from a gradual depletion of sphingolipids. Additional hits in our phosphoproteomic screens highlight the intricate control TORC2 exerts over diverse aspects of eukaryote cell physiology.

Keywords: cell signaling; lipid signaling; phosphoproteome; plasma membrane; protein kinase; target of rapamycin (TOR); target of rapamycin complex 2, Ypk1, sphingolipids, actin polarization, endocytosis, flippase kinase.


Figures

FIGURE 1.
FIGURE 1.
BHS345, an ATP-competitive TOR inhibitor as a tool to study TORC2 function. A, structures of BHS345, used here, and the related PI3K/mTOR inhibitor BEZ235. B, schematic of the TOR complexes in S. cerevisiae. Rapamycin-sensitive TORC1 is found in two variants, one with Tor1 as the catalytic component (TORC1-A) and the other with Tor2 as the catalytic component (TORC1-B). Tor2, but not Tor1, functions in rapamycin-insensitive TORC2. TORC1-A, TORC1-B, and TORC2 are all inhibited by BHS345. C, BHS345 dose-response curves of WT, TOR1MT (TOR1M2282T), TOR2MT (TOR2M2286T), and TOR1MT TOR2MT strains grown in SC. A600 was determined after 30 h of incubation at 30 °C. D, TORC1 and TORC2 activity status, respectively, assayed by Western blot detecting Sch9Thr-737 and Ypk1Thr-662 phosphorylation, in the indicated strains before and after treatment with rapamycin (200 nm, 20 min) or BHS345 (10 μm, 12 min).
FIGURE 2.
FIGURE 2.
TORC2 regulates actin polarization and endocytosis via Ypk1. A, left panel, and D, micrographs of TOR1MT cells treated for 90 min with Lucifer Yellow (LY) and either BHS345 (BHS) or drug vehicle as indicated. A, center panel, schematic demonstrating how Lucifer Yellow accumulation in the vacuole was quantified. Signal intensity of Lucifer Yellow was scored along a line that bisected the vacuole. The peak vacuolar signal (V) was divided by the minimum cytoplasmic signal (C) to generate the vacuolar/cytoplasmic signal ratio. A, right panel, and E, quantification of the vacuolar versus cytoplasmic accumulation of Lucifer Yellow in cells of the indicated genotypes after the indicated treatments. Two independent experiments were performed. Error bars represent mean ± S.E. Statistically significant differences are indicated (Student's t test) with p < 0.001 (***). B and F, micrographs showing MM4-64 accumulation in cells with the indicated genotype and after the indicated treatments. Cells were drug treated in SC media for 30 min, followed by 30-min incubation with 50 μm MM4-64 in YPD containing the drug. The values represent the percentage of cells with vacuolar staining ± S.E. C and G, micrographs of rhodamine phalloidin stained TOR1MT cells after the indicated treatments. The percentage of cells presenting polarized actin is indicated. Expression of hyperactive Ypk1D242A, but not an empty vector (EV), restores endocytosis (D, E, and F) and actin organization to BHS345-treated cells (C and G). A–G, BHS345 was used at 15 μm.
FIGURE 3.
FIGURE 3.
Sphingolipids are major mediators of TORC2 signaling. A, schematic of sphingolipid biosynthesis in yeast and its regulation by TORC2/Ypk1 via Orm1/2. Myriocin and aureobasidin A antagonize serine palmitoyltransferase and inositol phosphoceramide synthase, respectively. LCB, long-chain base; LCB-1P, long-chain base 1-phosphate; PHC, phytoceramide; IPC, inositol phosphoceramide; MIPC, mannosyl-inositol phosphoceramide; M(IP)2C, mannosyl-di-inositol phosphoceramide. B and C, tor2 lethality is suppressed by deletion of ORM1 and ORM2. Spore colonies obtained upon dissection of TOR2/tor2 (DRY49) and TOR2/tor2 ORM1/orm1 ORM2/orm2 (DRY50) diploids. No viable tor2 cells were obtained from 10 dissected asci obtained from TOR2/tor2 diploids (left panel). In contrast, viable tor2 cells (marked with red circles, right panel) were readily observed from dissected asci obtained from TOR2/tor2 ORM1/orm1 ORM2/orm2 diploids. These tor2 haploids all additionally harbored the orm1 and orm2 deletions. C, Orm double deletion suppresses lethality of tor2, demonstrated by the ability of tor2 orm1 orm2 cells to lose a URA3-marked plasmid containing YPK2D239A on 5-fluoroorotic acid (5-FOA) medium. D, micrographs of TOR1MT cells treated for 90 min with Lucifer Yellow (LY) and either myriocin (Myr) or aureobasidin A (AbA) as indicated. D, right panel, quantification of the vacuolar versus cytoplasmic accumulation of Lucifer Yellow after the indicated treatments. Statistically significant differences are indicated (Student's t test) with p < 0.001 (***). E, micrographs showing MM4-64 accumulation in TOR1MT cells after the indicated treatments. Numbers represent the percentage of cells with vacuolar labeling. F, micrographs of rhodamine phalloidin stained TOR1MT cells after the indicated treatments. D–F, cells were treated with 2.5 μm myriocin or 2.5 μm aureobasidin A.
FIGURE 4.
FIGURE 4.
Plasma membrane stress-induced actin depolarization is rescued by sorbitol addition. A, micrographs of rhodamine phalloidin-stained TOR1MT cells after hypo-osmotic shock (SC Sorb 1 mSC), heat shock (22 → 37 °C, in SC medium), or chlorpromazine (CPZ 500 μm, in SC medium) treatments. Numbers in the micrographs indicated the percentage of cells with polarized actin ± S.E. B, Western blots showing the extent of phosphorylation of Ypk1 at Thr-662 following the treatments as indicated in A. C and D, cells growing exponentially in SC medium, SC + 1 m sorbitol (Sorb), or SC + 2 m sorbitol were treated with myriocin, aureobasidin A, or BHS345 for the indicated times before processing with rhodamine phalloidin to visualize actin structures.
FIGURE 5.
FIGURE 5.
TORC2 regulates endocytosis and actin polarization not via the cell wall integrity pathway but via the flippase kinases Fpk1 and Fpk2. A, TOR1MT cells were treated with BHS345 for the indicated times before aliquots were removed to assess Slt2Thr-190/Tyr-192 and Ypk1Thr-662 phosphorylation by Western blotting. Hog1 was used as a loading control. B, deletion of FPK1 and FPK2 partially rescues the growth of TOR1MT cells in the presence of 10 μm BHS345. C, micrographs of TOR1MT and TOR1MT fpk1 fpk2 cells treated for 90 min with Lucifer Yellow (LY) and either BHS345 or drug vehicle with quantifications (right panel). D, micrographs of TOR1MT and TOR1MT fpk1 fpk2 cells showing MM4-64 accumulation after the indicated treatments. Numbers indicate the percentage of cells with vacuolar staining. E, micrographs of rhodamine phalloidin-stained TOR1MT and TOR1MT fpk1 fpk2 cells after the indicated treatments with BHS345. A and C–E, BHS345 was used at 15 μm.
FIGURE 6.
FIGURE 6.
TORC2 regulates phosphorylation of endocytic proteins independently of sphingolipids and Fpk proteins. A, experimental flowchart for the two independent phosphoproteomic experiments, each performed with biological triplicates. B, schematic of a budding vesicle with endocytic proteins. Red Ps demark proteins that become hypophosphorylated upon TORC2 inhibition. C, TOR1MT cells expressing Ent1–5HA and either an empty vector or a vector expressing hyperactive Ypk1D242A were treated as indicated. Denatured protein extracts were subsequently made, and RXX(S/T) motif phosphorylation of immunoprecipitated Ent1–5HA was assessed by Western blotting. D, TOR1MT cells expressing Pan1-GFP and either an empty vector, or a vector expressing hyperactive Ypk1D242A, were treated as indicated. The extent of Pan1-GFP phosphorylation was assessed by SDS-PAGE migration shifts. Rap, rapamycin. D and E, deletion of FPK1 and FPK2 does not block BHS345-induced Ent1 and Pan1 hypophosphorylation. C–E, BHS345 (BHS) was used at 15 μm, myriocin (Myr) at 2.5 μm, and aureobasidin A (AbA) at 2.5 μm.
FIGURE 7.
FIGURE 7.
Ent1 RXX(S/T) phosphorylation antagonizes actin polarization. A, HA-tagged WT or phosphosite mutant Ent1 was immunoprecipitated from TOR1MT ent1 ent2 cell extracts obtained from SC-grown cells that had be treated for 30 min with BHS345 or drug vehicle. RXX(S/T) motif phosphorylation of immunoprecipitated Ent1–5HA variants was assessed by Western blotting. B and C, micrographs and quantification of TOR1MT ent1 ent2 cells expressing Ent1-WT, Ent1-6A, or Ent1-6D treated for 60 min with Lucifer Yellow (LY) and either BHS345 (BHS) or drug vehicle as indicated. Quantification of the vacuolar versus cytoplasmic accumulation of Lucifer Yellow after the indicated treatments. Statistically significant differences are indicated (Student's t test) with p < 0.001 (***) and p < 0.05 (*). D, micrographs showing MM4-64 accumulation in TOR1MT ent1 ent2 expressing Ent1-WT/6A/6D cells after the indicated treatments. Numbers represent the percentage of cells with vacuolar labeling. E, micrographs of rhodamine phalloidin stained TOR1MT ent1 ent2 expressing Ent1-WT/6A/6D cells after 60 min with the indicated treatments. A–E, cells were grown in SC medium, and where indicated, BHS345 was used at 15 μm.
FIGURE 8.
FIGURE 8.
Hierarchy of TORC2 distal effectors. TORC2 regulates actin polarization and endocytosis via three distinct pathways. 1, a fast, “direct” pathway potentially involving direct phosphorylation of endocytic proteins by Ypk1. 2, a slow, “indirect” pathway involving the depletion of sphingolipids and a subsequent increase in plasma membrane tension or related stress; and 3, a fast pathway involving undefined Fpk1/2 targets.

References

    1. Shertz C. A., Bastidas R. J., Li W., Heitman J., Cardenas M. E. (2010) Conservation, duplication, and loss of the Tor signaling pathway in the fungal kingdom. BMC Genomics 11, 510. - PMC - PubMed
    1. Cafferkey R., Young P. R., McLaughlin M. M., Bergsma D. J., Koltin Y., Sathe G. M., Faucette L., Eng W. K., Johnson R. K., Livi G. P. (1993) Dominant missense mutations in a novel yeast protein related to mammalian phosphatidylinositol 3-kinase and VPS34 abrogate rapamycin cytotoxicity. Mol. Cell. Biol. 13, 6012–6023 - PMC - PubMed
    1. Heitman J., Movva N. R., Hall M. N. (1991) Targets for cell cycle arrest by the immunosuppressant rapamycin in yeast. Science 253, 905–909 - PubMed
    1. Helliwell S. B., Wagner P., Kunz J., Deuter-Reinhard M., Henriquez R., Hall M. N. (1994) TOR1 and TOR2 are structurally and functionally similar but not identical phosphatidylinositol kinase homologues in yeast. Mol. Biol. Cell 5, 105–118 - PMC - PubMed
    1. Kunz J., Henriquez R., Schneider U., Deuter-Reinhard M., Movva N. R., Hall M. N. (1993) Target of rapamycin in yeast, TOR2, is an essential phosphatidylinositol kinase homolog required for G1 progression. Cell 73, 585–596 - PubMed

Publication types

MeSH terms

LinkOut - more resources