. 2015 Aug 18;43(14):e92.
doi: 10.1093/nar/gkv338. Epub 2015 Apr 16.

Thioflavin T as a fluorescence probe for monitoring RNA metabolism at molecular and cellular levels

Affiliations

Thioflavin T as a fluorescence probe for monitoring RNA metabolism at molecular and cellular levels

Shinya Sugimoto et al. Nucleic Acids Res. .

Abstract

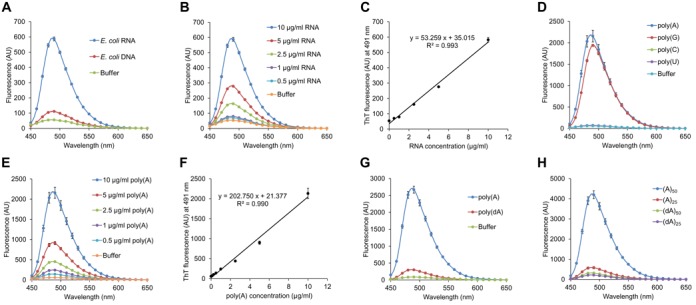
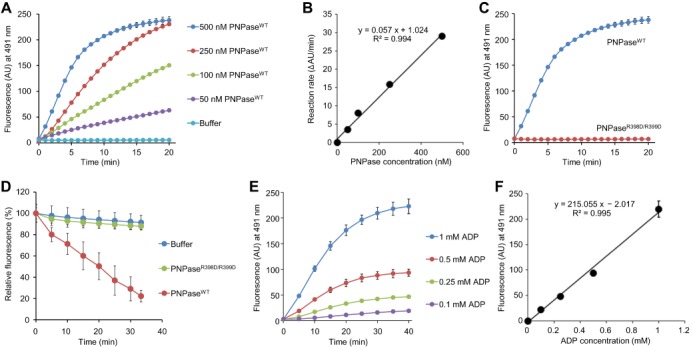
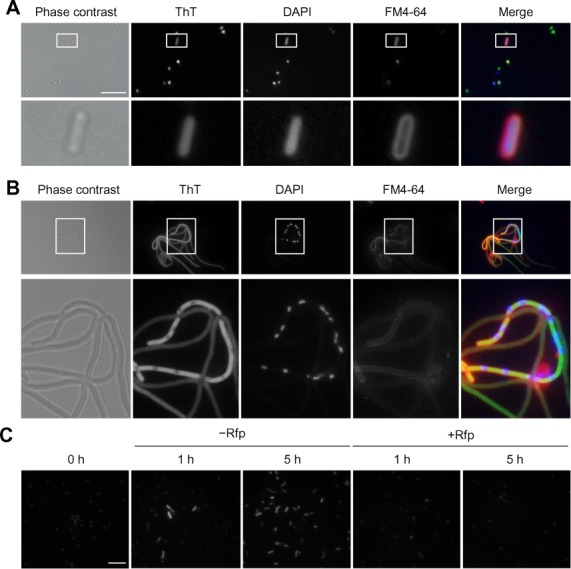
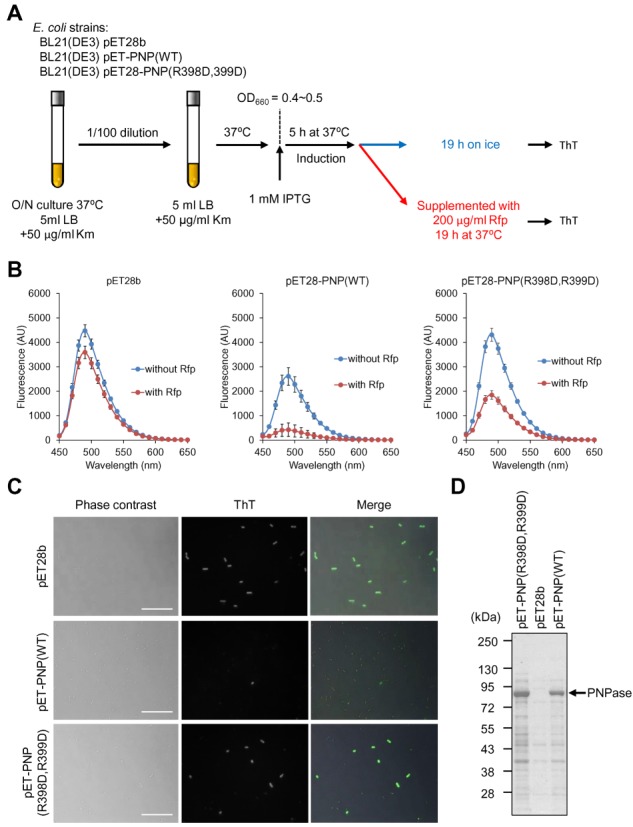
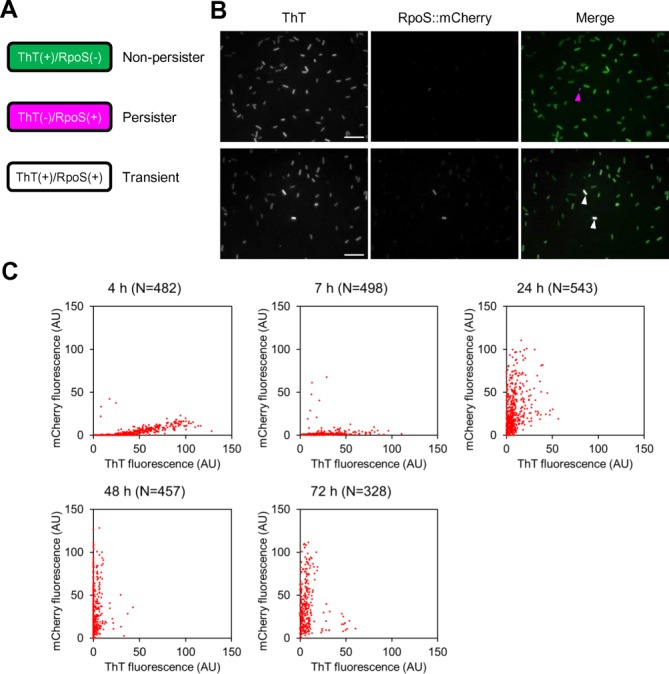
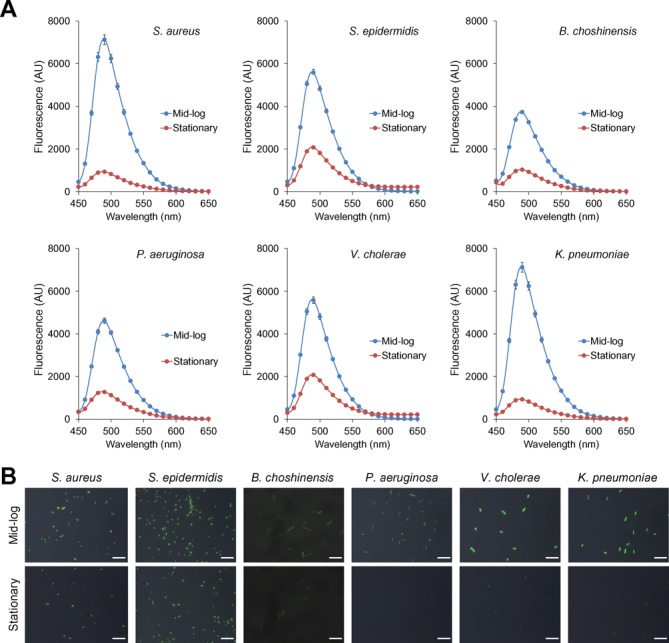
The intrinsically stochastic dynamics of mRNA metabolism have important consequences on gene regulation and non-genetic cell-to-cell variability; however, no generally applicable methods exist for studying such stochastic processes quantitatively. Here, we describe the use of the amyloid-binding probe Thioflavin T (ThT) for monitoring RNA metabolism in vitro and in vivo. ThT fluoresced strongly in complex with bacterial total RNA than with genomic DNA. ThT bound purine oligoribonucleotides preferentially over pyrimidine oligoribonucleotides and oligodeoxyribonucleotides. This property enabled quantitative real-time monitoring of poly(A) synthesis and phosphorolysis by polyribonucleotide phosphorylase in vitro. Cellular analyses, in combination with genetic approaches and the transcription-inhibitor rifampicin treatment, demonstrated that ThT mainly stained mRNA in actively dividing Escherichia coli cells. ThT also facilitated mRNA metabolism profiling at the single-cell level in diverse bacteria. Furthermore, ThT can also be used to visualise transitions between non-persister and persister cell states, a phenomenon of isogenic subpopulations of antibiotic-sensitive bacteria that acquire tolerance to multiple antibiotics due to stochastically induced dormant states. Collectively, these results suggest that probing mRNA dynamics with ThT is a broadly applicable approach ranging from the molecular level to the single-cell level.


Figures

Figure 1.
Figure 1.
ThT quantitatively binds to purine bases of RNA. (A and B) ThT fluorescence spectra of RNA (10 μg/ml Escherichia coli total RNA) and DNA (10 μg/ml E. coli genomic DNA) were measured. (C) Fluorescence intensities at 491 nm recorded in (B) were plotted against RNA concentrations. Approximation straight line and its formula are shown with a correlation coefficient. (D, G and H) ThT fluorescence spectra of poly(A), poly(G), poly(C), poly(U), poly(dA), oligoribonucleotides (A)50 and (A)25, and oligodeoxyribonucleotides (dA)50 and (dA)25 were measured at 10 μg/ml. (E) ThT fluorescence spectra of poly(A) were measured at the indicated concentrations. (F) Fluorescence intensities at 491 nm recorded in (E) were plotted against poly(A) concentrations. The approximation line and its formula are shown with a correlation coefficient. Data points represent the means and standard deviations of results from three independent experiments. The standard deviation is less than that corresponding to the size of the symbol if no error bars are seen.
Figure 2.
Figure 2.
ThT is available for measuring activities of PNPase in vitro. (A and B) The kinetics and PNPase dose-dependency of poly(A) synthesis can be monitored at 25°C as a function of increase in ThT fluorescence. (A) The indicated concentrations of PNPaseWT were incubated with 1 mM ADP and 25 μM ThT and the real-time increases in fluorescence were recorded by spectrofluorometer. (B) The initial rates of the increase in the intensity (ΔAU/ml) were plotted against PNPase concentrations. The approximation line and its formula are shown with a correlation coefficient. (C and D) Poly(A) synthesis and degradation activities of PNPaseWT were compared with those of PNPaseR398D/R399D. (C) Poly(A) synthesis by 250 nM PNPaseWT or 250 nM PNPaseR398D/R399D was monitored as described in (A). (D) Real-time changes of fluorescence intensity at 491 nm was monitored in the presence of 1 μM PNPaseWT or PNPaseR398D/R399D. (E) The kinetics and ADP dose-dependency of poly(A) synthesis can be monitored at 25°C in the presence of the indicated concentrations of ADP, 200 nM PNPaseWT and 25 μM ThT. (F) Fluorescence intensities recorded in (E) at 40 min were plotted against ADP concentrations. The approximation line and its formula are shown with a correlation coefficient. Data points represent the means and standard deviations of results from three independent experiments. The standard deviation is less than that corresponding to the size of the symbol if no error bars are seen.
Figure 3.
Figure 3.
Cellular RNA metabolism can be monitored with ThT. (A) Escherichia coli K-12 BW25113 cells grown in LB medium at 37°C for 16 h were stained with ThT (green), DAPI (blue), and FM4–64 (red) and the stained cells were observed under fluorescence microscopy. Phase contrast and fluorescence images are shown in grey scale and merged images are shown in original colours. (B) Log-phase cells of E. coli JEFZ1 containing the ftsZ84 allele cultured in LB salt free medium at 37°C were also stained and observed similarly. (C) Overnight culture of BW25113 cells was transferred to fresh LB medium and incubated in the absence or presence of 100 μg/ml Rfp at 37°C. At the indicated time points, cells were harvested, stained with ThT and observed by fluorescence microscopy. Scale bars indicate 10 μm.
Figure 4.
Figure 4.
ThT is available for measuring RNA metabolic enzyme activities in vivo. (A) Experimental procedures are schematically described. Overnight culture of Escherichia coli strains were diluted 100-fold into fresh LB medium containing kanamycin (Km) and incubated until OD660 reached to 0.4–0.5. Subsequently the culture was supplemented with 1 mM IPTG and the expression of PNPase variants were induced at 37°C for 5 h. The culture was divided into two tubes; one of them was incubated on ice for 19 h and the other was supplemented with 200 μg/ml rifampicin (Rfp) and incubated at 37°C for 19 h. After removal of culture supernatant, equal wet weights of cells were suspended into PBS containing 25 μM ThT. ThT fluorescent spectra of the suspensions were measured using a spectrofluorometer (B), and cells were observed under fluorescence microscopy (C). (B) Data points represent the means and standard deviations of results from three independent experiments. The standard deviation is less than that corresponding to the size of the symbol if no error bars are seen. (C) Scale bars indicate 10 μm. (D) Expression of PNPase variants were checked by SDS-PAGE with CBB staining. Positions of molecular mass markers are represented at the left of the panel.
Figure 5.
Figure 5.
ThT is applicable for visualizing transitions between non-persister cells and persister cells. (A) Using an RpoS::mCherry reporter system, persister cells can be distinguished from non-persister cells as red fluorescent cells (pseudo-coloured in magenta). Non-persister cells are actively dividing and their mRNA level may be high enough for representing bright ThT fluorescence (green) in the presence of the fluorescence probe. Transient state cells (from non-persister to persister state or vice versa) are thought to exhibit green and magenta and are therefore in white when both fluorescence images are merged. (B) ThT fluorescence and mCherry fluorescence images of Escherichia coli MG1655 rpoS::mcherry cells at log phase (4 h) are shown in grey scale. These images are merged in the right panel. Many green cells and a few magenta cells are observed at the indicated time points. Magenta and white arrowheads represent ThT-negative/RpoS::mCherry-positive (persister) and ThT-positive/RpoS::mCherry-positive (transient) cells, respectively. Scale bars represent 10 μm. (C) E. coli MG1655 rpoS::mcherry cells were harvested and observed under fluorescence microscopy at the indicated periods. Intensities of ThT fluorescence and mCherry fluorescence of individual cells were quantified using Image J and plotted. Growth curve and microscopic images of the strain are shown in Supplementary Figures S5 and S6, respectively.
Figure 6.
Figure 6.
ThT stains various bacterial cells in a growth-phase-dependent manner. (A) Gram-positive (Staphylococcus aureus, Staphylococcus epidermidis and Brevibacillus choshinensis) and Gram-negative bacterial cells (Pseudomonas aeruginosa, Vibrio cholerae and Klebsiella pneumoniae) were harvested at the mid-log (3–5 h) and stationary phases (24 h) and were suspended into PBS containing 25 μM ThT. Fluorescence spectra were recorded with excitation at 438 nm. Data points represent the means and standard deviations of results from three independent experiments. The standard deviation is less than that corresponding to the size of the symbol if no error bars are seen. (B) Fluorescence and phase contrast images of the indicated bacteria are captured in the presence of ThT. Merged images of ThT fluorescence and phase contrast images are shown. Scale bars represent 10 μm.

Similar articles

Cited by

References

    1. Elowitz M.B., Levine A.J., Siggia E.D., Swain P.S. Stochastic gene expression in a single cell. Science. 2002;297:1183–1186. - PubMed
    1. Ozbudak E.M., Thattai M., Kurtser I., Grossman A.D., van Oudenaarden A. Regulation of noise in the expression of a single gene. Nat. Genet. 2002;31:69–73. - PubMed
    1. Blake W.J., KAErn M., Cantor C.R., Collins J.J. Noise in eukaryotic gene expression. Nature. 2003;422:633–637. - PubMed
    1. Kussell E., Leibler S. Phenotypic diversity, population growth, and information in fluctuating environments. Science. 2005;309:2075–2078. - PubMed
    1. Süe G.M., Kulkarni R.P., Dworkin J., Garcia-Ojalvo J., Elowitz M.B. Tunability and noise dependence in differentiation dynamics. Science. 2007;315:1716–1719. - PubMed

Publication types

MeSH terms