

Comparison of a healthy miRNome with melanoma patient miRNomes: are microRNAs suitable serum biomarkers for cancer?
- PMID: 25883223
- PMCID: PMC4494926
- DOI: 10.18632/oncotarget.3661
Comparison of a healthy miRNome with melanoma patient miRNomes: are microRNAs suitable serum biomarkers for cancer?
Abstract
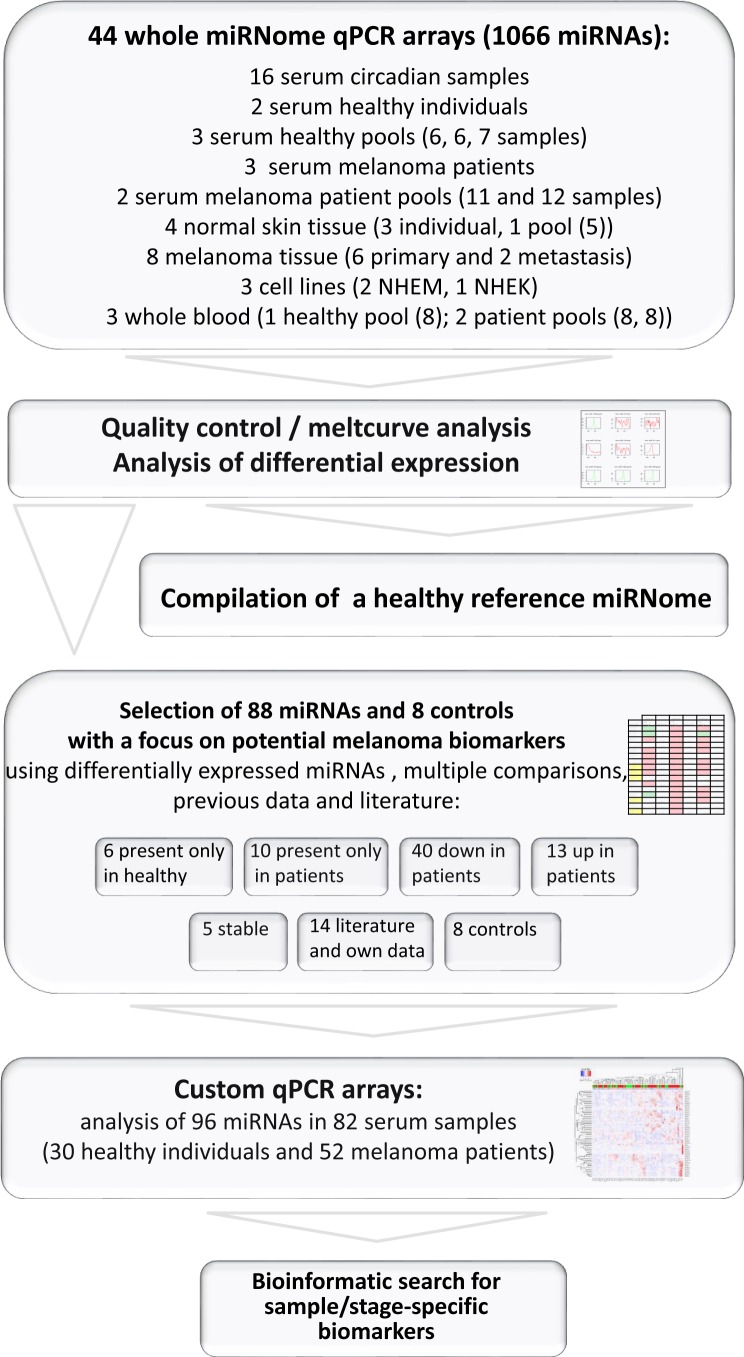
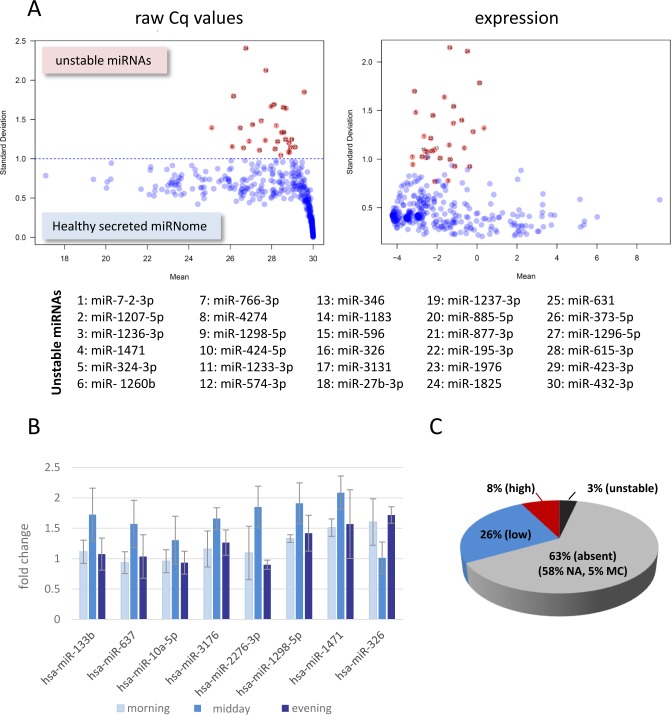
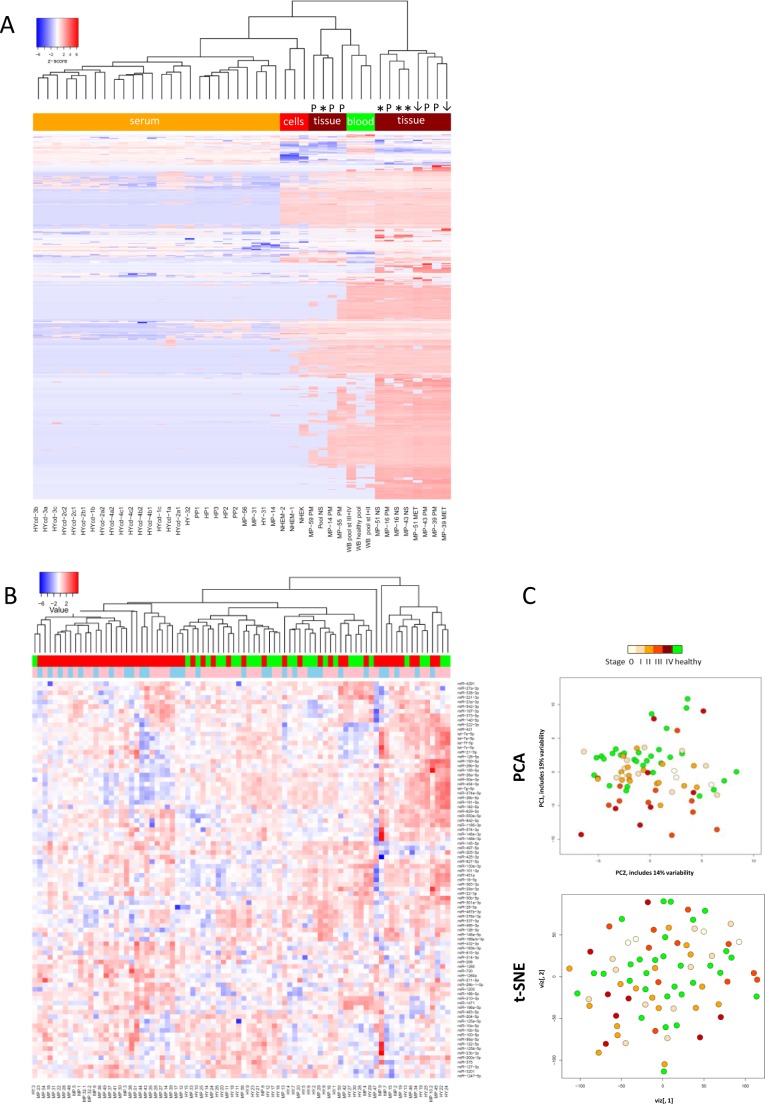
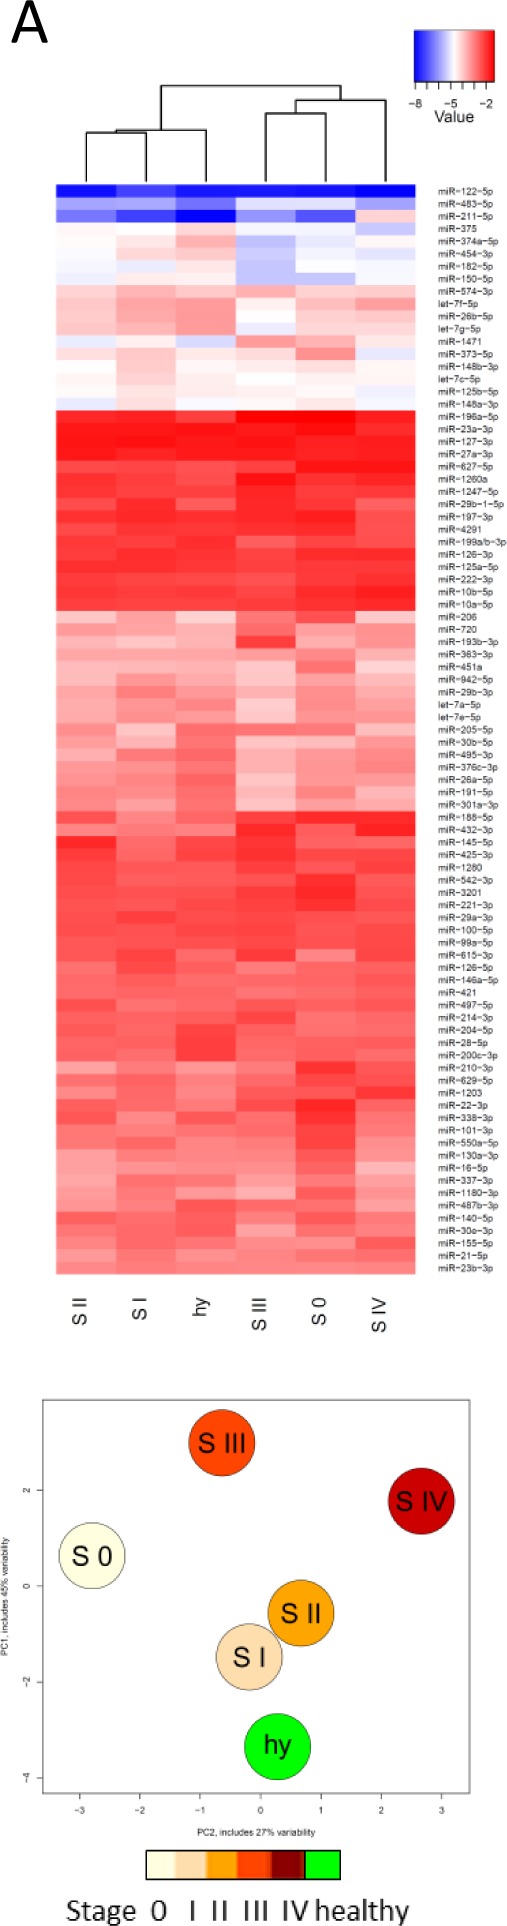
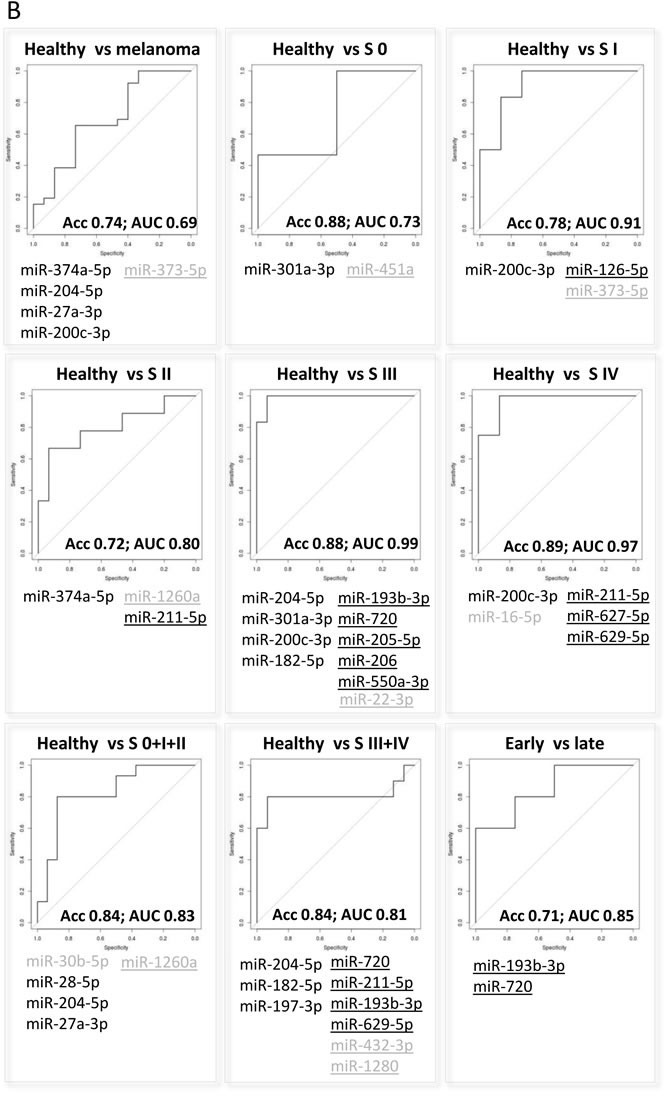
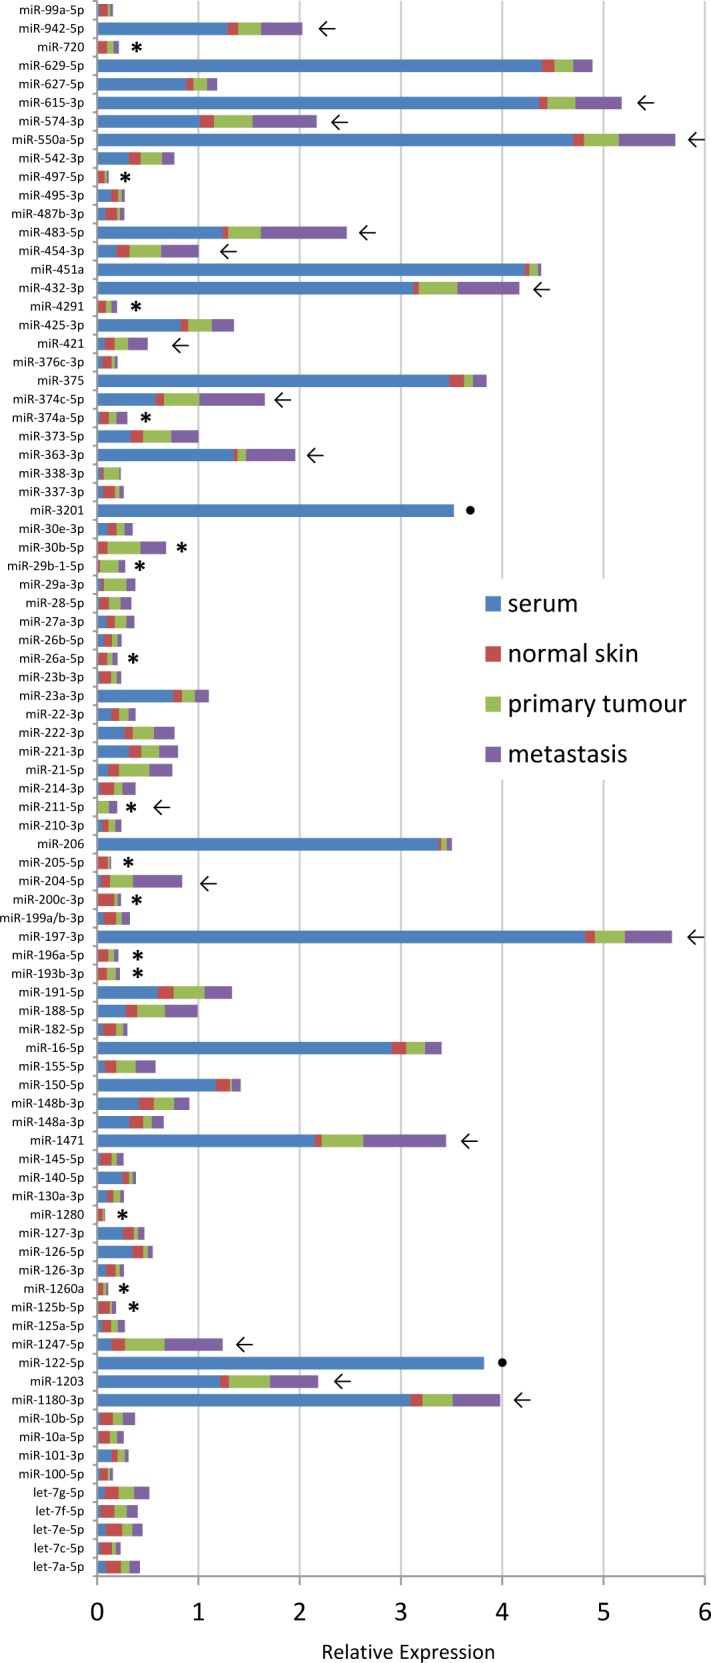
MiRNAs are increasingly recognized as biomarkers for the diagnosis of cancers where they are profiled from tumor tissue (intracellular miRNAs) or serum/plasma samples (extracellular miRNAs). To improve detection of reliable biomarkers from blood samples, we first compiled a healthy reference miRNome and established a well-controlled analysis pipeline allowing for standardized quantification of circulating miRNAs. Using whole miRNome and custom qPCR arrays, miRNA expression profiles were analyzed in 126 serum, whole blood and tissue samples of healthy volunteers and melanoma patients and in primary melanocyte and keratinocyte cell lines. We found characteristic signatures with excellent prognostic scores only in late stage but not in early stage melanoma patients. Upon comparison of melanoma tissue miRNomes with matching serum samples, several miRNAs were identified to be exclusively tissue-derived (miR-30b-5p, miR-374a-5p and others) while others had higher expression levels in serum (miR-3201 and miR-122-5p). Here we have compiled a healthy and widely applicable miRNome from serum samples and we provide strong evidence that levels of cell-free miRNAs only change significantly at later stages of melanoma progression, which has serious implications for miRNA biomarker studies in cancer.
Keywords: circulating miRNAs; healthy miRNome; melanoma biomarkers; miRNA qPCR arrays; serum/tissue samples.
Figures
Similar articles
-
Diagnostic and prognostic significance of miRNA signatures in tissues and plasma of endometrioid endometrial carcinoma patients.Int J Cancer. 2013 Apr 1;132(7):1633-45. doi: 10.1002/ijc.27840. Epub 2012 Oct 17. Int J Cancer. 2013. PMID: 22987275
-
Dysregulated Serum MiRNA Profile and Promising Biomarkers in Dengue-infected Patients.Int J Med Sci. 2016 Feb 18;13(3):195-205. doi: 10.7150/ijms.13996. eCollection 2016. Int J Med Sci. 2016. PMID: 26941580 Free PMC article.
-
Dysregulated Serum MicroRNA Expression Profile and Potential Biomarkers in Hepatitis C Virus-infected Patients.Int J Med Sci. 2015 Jul 16;12(7):590-8. doi: 10.7150/ijms.11525. eCollection 2015. Int J Med Sci. 2015. PMID: 26283876 Free PMC article.
-
The use of circulating microRNAs as diagnostic biomarkers in colorectal cancer.Cancer Biomark. 2015;15(2):103-13. doi: 10.3233/CBM-140456. Cancer Biomark. 2015. PMID: 25547322 Review.
-
Identification, Review, and Systematic Cross-Validation of microRNA Prognostic Signatures in Metastatic Melanoma.J Invest Dermatol. 2016 Jan;136(1):245-254. doi: 10.1038/JID.2015.355. J Invest Dermatol. 2016. PMID: 26763444 Review.
Cited by
-
Circulating miRNAs in Small Extracellular Vesicles Secreted by a Human Melanoma Xenograft in Mouse Brains.Cancers (Basel). 2020 Jun 19;12(6):1635. doi: 10.3390/cancers12061635. Cancers (Basel). 2020. PMID: 32575666 Free PMC article.
-
[miR-122-5p inhibits the proliferation of melanoma cells by targeting NOP14].Nan Fang Yi Ke Da Xue Xue Bao. 2018 Nov 30;38(11):1360-1365. doi: 10.12122/j.issn.1673-4254.2018.11.14. Nan Fang Yi Ke Da Xue Xue Bao. 2018. PMID: 30514686 Free PMC article. Chinese.
-
Promising Blood-Based Biomarkers for Melanoma: Recent Progress of Liquid Biopsy and Its Future Perspectives.Curr Treat Options Oncol. 2022 Apr;23(4):562-577. doi: 10.1007/s11864-022-00948-2. Epub 2022 Mar 17. Curr Treat Options Oncol. 2022. PMID: 35298769 Review.
-
Development and validation of a plasma-based melanoma biomarker suitable for clinical use.Br J Cancer. 2018 Mar 20;118(6):857-866. doi: 10.1038/bjc.2017.477. Epub 2018 Jan 23. Br J Cancer. 2018. PMID: 29360813 Free PMC article.
-
MiR-3201 as a Prognostic Blood Biomarker for Curative Treatments in Hepatocellular Carcinoma.Technol Cancer Res Treat. 2022 Jan-Dec;21:15330338221132924. doi: 10.1177/15330338221132924. Technol Cancer Res Treat. 2022. PMID: 36537076 Free PMC article.
References
-
- Biomarkers surrogate endpoints: preferred definitions and conceptual framework. Clinical pharmacology and therapeutics. 2001;69:89–95. - PubMed
-
- Schwarzenbach H, Nishida N, Calin GA, Pantel K. Clinical relevance of circulating cell-free microRNAs in cancer. Nature reviews Clinical oncology. 2014;11:145–56. - PubMed
Publication types
MeSH terms
Substances
LinkOut - more resources
Full Text Sources
Other Literature Sources
Medical
