. 2015 Jun;25(6):858-71.
doi: 10.1101/gr.184390.114. Epub 2015 Apr 16.

Antagonistic regulation of mRNA expression and splicing by CELF and MBNL proteins

Affiliations

Antagonistic regulation of mRNA expression and splicing by CELF and MBNL proteins

Eric T Wang et al. Genome Res. 2015 Jun.

Abstract

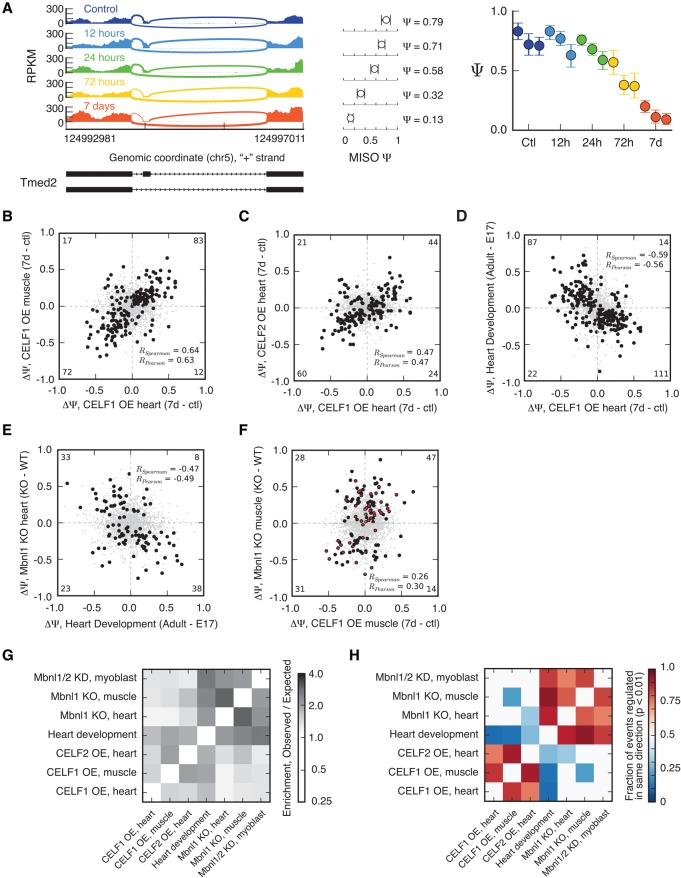
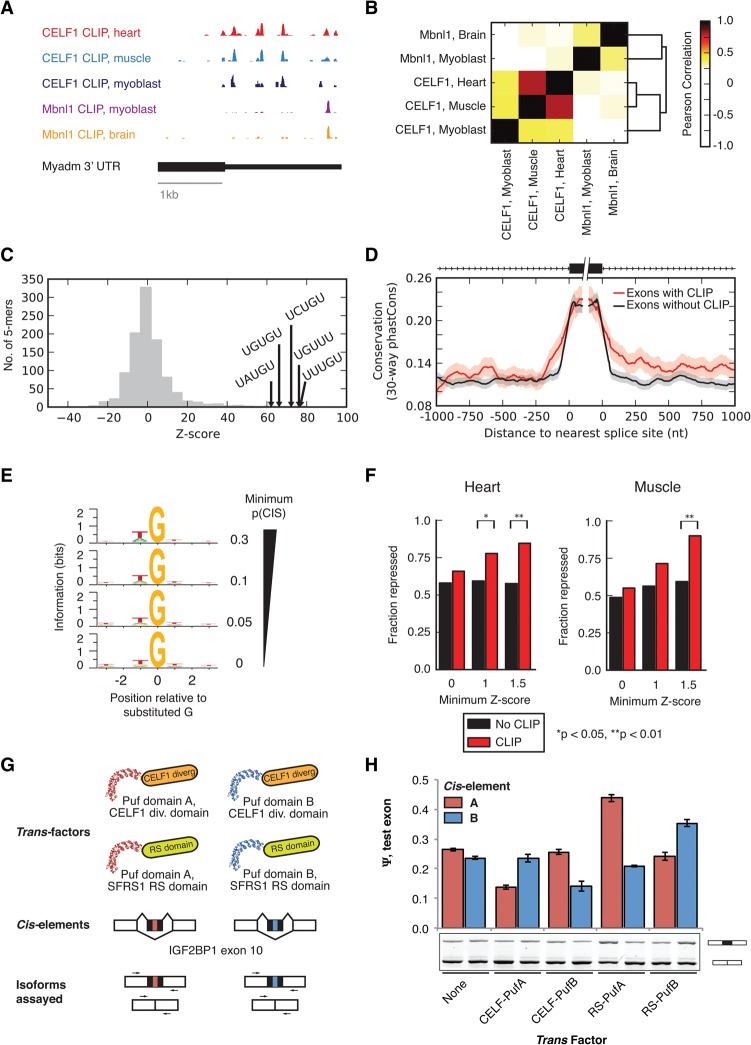
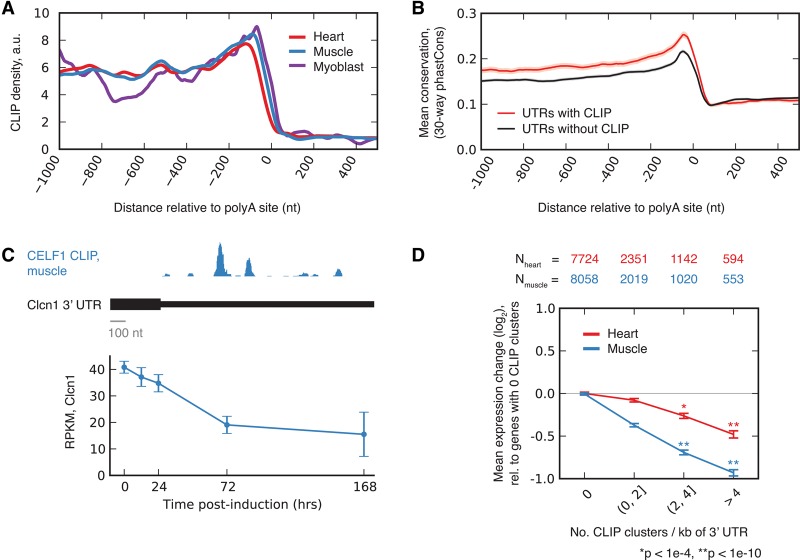
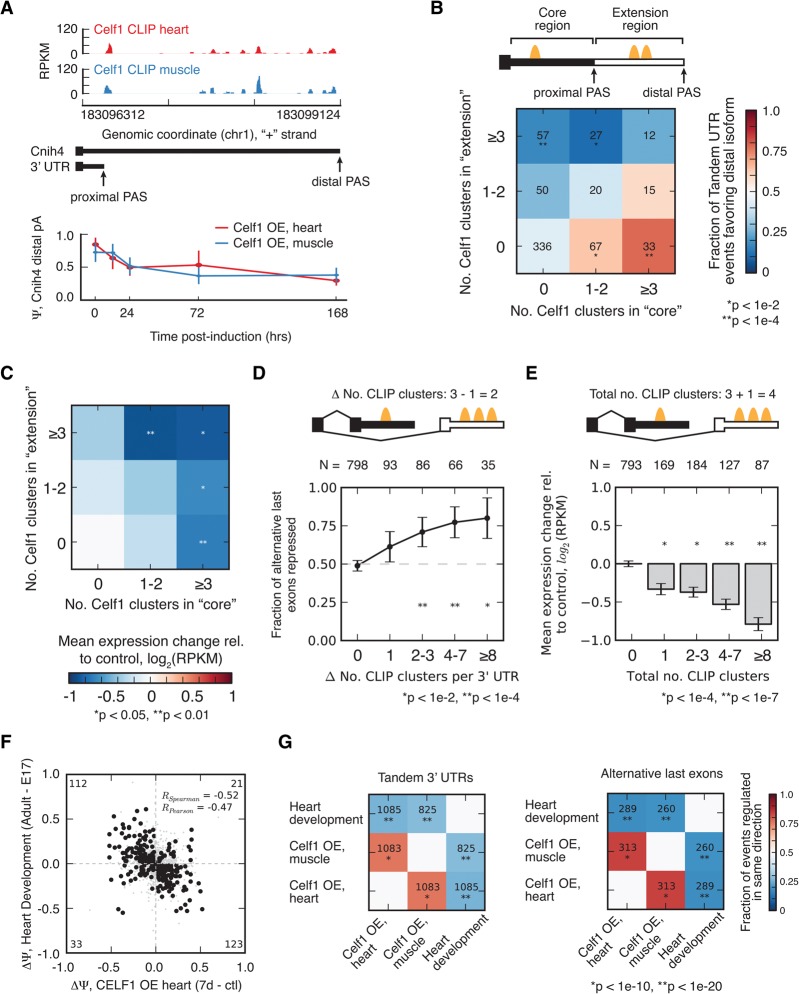
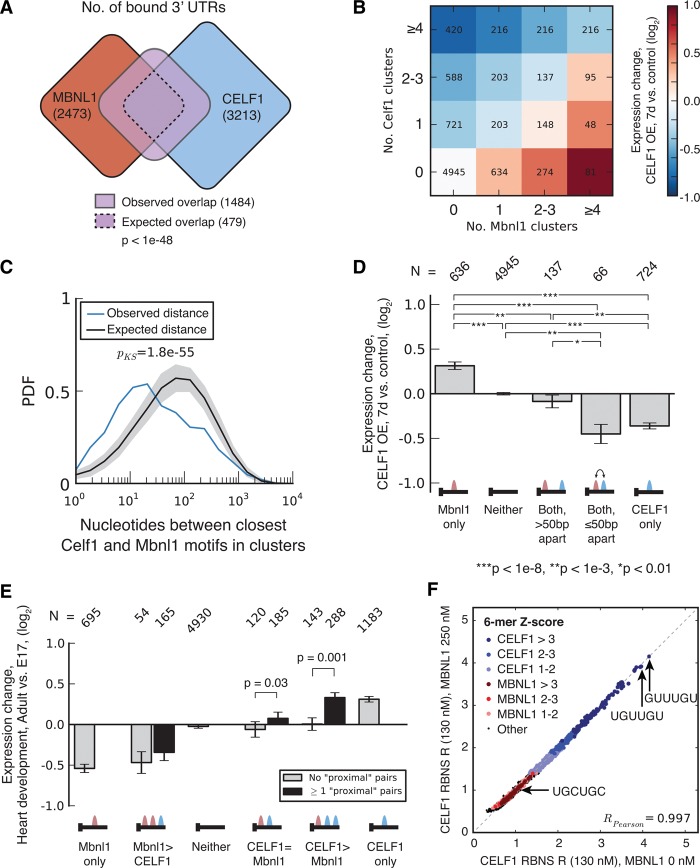
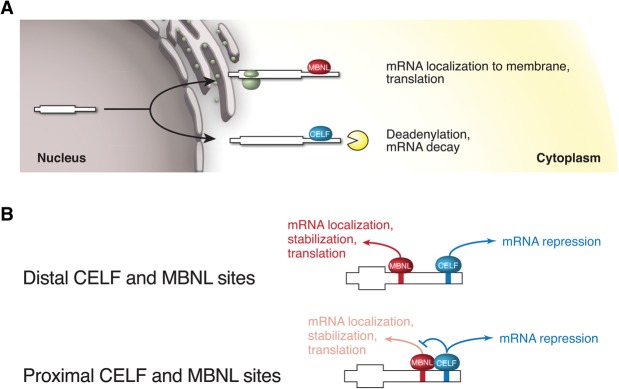
RNA binding proteins of the conserved CUGBP1, Elav-like factor (CELF) family contribute to heart and skeletal muscle development and are implicated in myotonic dystrophy (DM). To understand their genome-wide functions, we analyzed the transcriptome dynamics following induction of CELF1 or CELF2 in adult mouse heart and of CELF1 in muscle by RNA-seq, complemented by crosslinking/immunoprecipitation-sequencing (CLIP-seq) analysis of mouse cells and tissues to distinguish direct from indirect regulatory targets. We identified hundreds of mRNAs bound in their 3' UTRs by both CELF1 and the developmentally induced MBNL1 protein, a threefold greater overlap in target messages than expected, including messages involved in development and cell differentiation. The extent of 3' UTR binding by CELF1 and MBNL1 predicted the degree of mRNA repression or stabilization, respectively, following CELF1 induction. However, CELF1's RNA binding specificity in vitro was not detectably altered by coincubation with recombinant MBNL1. These findings support a model in which CELF and MBNL proteins bind independently to mRNAs but functionally compete to specify down-regulation or localization/stabilization, respectively, of hundreds of mRNA targets. Expression of many alternative 3' UTR isoforms was altered following CELF1 induction, with 3' UTR binding associated with down-regulation of isoforms and genes. The splicing of hundreds of alternative exons was oppositely regulated by these proteins, confirming an additional layer of regulatory antagonism previously observed in a handful of cases. The regulatory relationships between CELFs and MBNLs in control of both mRNA abundance and splicing appear to have evolved to enhance developmental transitions in major classes of heart and muscle genes.


Figures

Figure 1.
Figure 1.
CELF1 and CELF2 regulate hundreds of splicing events, reversing many changes during heart development and antagonizing a subset of Mbnl-regulated exons. (A) RNA-seq read coverage across Tmed2 exon 3 from mouse heart at several time points following CELF1 induction. MISO Ψ values and 95% confidence intervals shown at right. (B) Splicing changes that occur following CELF1 overexpression (OE) in heart correlate with splicing changes that occur following CELF1 overexpression in muscle. n = 2496 alternative splicing events (skipped exons, alternative 3′ splice sites, alternative 5′ splice sites, retained introns, and mutually exclusive exons) shown: Monotonically changing exons shown as black circles, others as gray dots. Correlation values of monotonic events (shown) are higher than for all events: The numbers of monotonic events in each quadrant are shown in corners. (C) Splicing changes that occur in response to CELF1 overexpression in heart correlate with splicing changes that occur in response to CELF2 overexpression in heart. As in B, with n = 2129 skipped exons shown. (D) Splicing changes that occur in response to CELF1 overexpression in heart inversely correlate with splicing changes that occur during mouse heart development. As in B, with n = 1952 skipped exons shown. (E) Splicing changes that occur in Mbnl1 KO heart inversely correlate with splicing changes that occur during mouse heart development. n = 3190 skipped exons shown, as in B. (F) Splicing changes that occur in Mbnl1 KO muscle correlate with splicing changes that occur following CELF1 overexpression in muscle. n = 1501 skipped exons shown. Events that changed monotonically, or with BF > 5, following CELF1 overexpression in muscle or Mbnl1 KO in muscle, respectively, are shown in black, and correlations are listed for these events. Events that also changed monotonically during heart development are shown in red. (G) Exons regulated during heart development also tend to change in Mbnl1 and Mbnl2 knockdown myoblasts, in Mbnl1 and Mbnl2 knockout mice, and in CELF1 or CELF2 overexpressing mice. Enrichment (observed/expected number of regulated exons) is shown in the heatmap. (H) Splicing of exons regulated in response to CELF overexpression or Mbnl depletion tends to change in a direction opposite from changes that occur during heart development. The fraction of events changing in the same direction for each pair of comparisons is shown in the heatmap (only biases significant at P < 0.01 by binomial test are colored). See also Supplemental Figures S1 and S2 and Supplemental Tables S1–S4.
Figure 2.
Figure 2.
CELF1 binds to consistent locations across cells and tissues and represses splicing of bound exons. (A) CELF1 CLIP-seq read coverage across the 3′ UTR of the mouse Myadm gene. Binding locations are highly correlated between muscle and heart. (B) Correlation of CLIP tag densities in 5-nt windows across all 3′ UTRs expressed in mouse heart, muscle, and myoblasts. (C) Histogram of enrichment Z-scores of 5mers based on frequency of occurrence in CELF1 heart CLIP clusters relative to control regions from the 3′ UTRs. (D) Meta-exon analysis of conservation (mean + 95% confidence interval of phastCons score in 5-nt windows shown) at a range of distances from 3′ and 5′ splice sites of exons with (red) and without (black) overlapping CELF1 CLIP clusters in heart. n = 432 skipped exons shown. (E) Information content (relative entropy compared to uniform) of genomic positions in regions where CELF1 CLIP-seq reads map, grouped by the frequency of substitution in CLIP reads relative to genome of the central G position. (F) Fraction of significantly repressed exons (Ψ at 7 d < Ψ in control animals) with or without CLIP clusters, at three thresholds of monotonicity Z-score from CELF1 overexpression time courses in heart and muscle. Significance was assessed by binomial test, where the number of events with CLIP clusters that were repressed was compared to the fraction of events without CLIP clusters that were repressed. (G) Design of experiment involving splicing reporters and Pumilio-based synthetic splicing factors, as well as assessment of splicing by qRT-PCR. (H) Tethering the divergent domain of CELF1 to a cassette exon in a splicing reporter by Pumilio fusion promotes exon skipping. In a positive control, tethering of RS domains to the cassette exon enhances exon inclusion. Enhancement by RS and repression by CELF1 occur only when the Pumilio domain has affinity for the inserted oligonucleotide. See also Supplemental Figures S3 and S4 and Supplemental Table S5.
Figure 3.
Figure 3.
CELF1 binds to 3′ UTRs and regulates message stability in a dose-dependent fashion. (A) Mean CELF1 CLIP density at positions along 3′ UTRs in heart, muscle, and myoblasts. (B) Mean conservation in sets of 3′ UTRs with and without CELF1 CLIP clusters with similar expression levels and UTR lengths (shading represents SEM). (C) Expression of Clcn1 in muscle based on RNA-seq (mean ± SD) at various times following CELF1 overexpression (bottom); CLIP density in Clcn1 3′ UTR (top). (D) Mean log expression change following CELF1 induction (7 d over control) for transcripts grouped by number of CELF1 CLIP clusters in their 3′ UTRs. Transcripts with greater CLIP cluster density are down-regulated more strongly in heart and muscle (number of genes in each category listed above). Significance was assessed by rank-sum test, where each CLIP cluster bin was compared to the zero CLIP cluster bin. See also Supplemental Table S6.
Figure 4.
Figure 4.
CELF1 regulates abundance of bound alternative 3′ UTRs, reversing developmental changes. (A) CELF1 CLIP-seq density in 3′ UTR of the Cnih4 gene, which has two alternative PASs whose relative abundance changes following CELF1 overexpression and during heart development. (B) CELF1 regulates tandem 3′ UTR events in a manner that is dependent on the number of binding sites in the core and/or extension region of the 3′ UTR. The heatmap shows the fraction of tandem UTR events biased toward usage of the proximal PAS following CELF1 overexpression in muscle for events grouped by the number of CLIP clusters in the proximal or distal region of the 3′ UTR (MZ > 1.6). Significance was assessed by binomial test, assuming equal likelihood for usage of long or short isoforms. (C) Messages with regulated tandem 3′ UTR events tend to be down-regulated following CELF1 induction. The heatmap shows the mean expression change following CELF1 induction in muscle for genes harboring events grouped by the number of CLIP clusters in the proximal or distal region of the 3′ UTR. Significance was assessed by rank-sum test, where each bin was compared to the bin with zero CLIP clusters. (D) CELF1 regulates ALE expression in a manner that is dependent on the number of binding sites in the competing 3′ UTRs. The fraction of ALEs that is significantly repressed following CELF1 overexpression in muscle, grouped by density in repressed 3′ UTR minus density in enhanced 3′ UTR (MZ > 1.5). Significance was assessed by binomial test, assuming equal likelihood for usage of each ALE isoform. (E) Messages with CELF1 binding within ALEs tend to be down-regulated following CELF1 induction. (Bar plot) Mean expression change following CELF1 induction in muscle for genes with varying numbers of CLIP clusters within ALEs. Significance was assessed by rank-sum test relative to genes with no CLIP clusters. (F) Changes in ALE usage during heart development inversely correlate with those that occur in response to CELF1 overexpression in heart. Correlation coefficients shown for events meeting a minimum Z-score threshold (heart development, 1.4; CELF1 OE, 1.8), as in Figure 1B. (G) Spearman correlation coefficients and significance of correlation are displayed in heatmap format for change in ALE usage (right) or change in tandem 3′ UTR usage (left) for pairwise comparisons of isoform changes during heart development, CELF1 overexpression in heart, and CELF1 overexpression in muscle. See also Supplemental Figure S6.
Figure 5.
Figure 5.
CELF1 and MBNL1 bind in close proximity to the same 3′ UTRs and exert opposing effects on mRNA stability. (A) Venn diagram showing the expected and observed overlap between CELF1 and MBNL1 3′ UTR targets (CELF1 data from muscle, MBNL1 data from myoblasts). The observed overlap is approximately three times larger than expected (analysis controlled for gene expression) and significant by Fisher's exact test. (B) Expression change following CELF1 induction in muscle (7 d versus control) for transcripts grouped by number of MBNL1 and CELF1 CLIP clusters in the 3′ UTR. CLIP clusters for MBNL1 and CELF1 were derived from myoblast and muscle, respectively. (C) The probability density function (PDF) of the distribution of distances between CELF1 CLIP clusters in muscle and MBNL1 CLIP clusters in myoblasts, in 3′ UTRs with binding for both proteins. Distances for true binding sites are shown in blue; for randomly placed binding sites, in black. Statistical significance was assessed by modified KS test, and the distribution of distances in shuffled controls is shown in gray. (D) Expression change following CELF1 induction in muscle (7 d versus control) for transcripts with exactly one MBNL1 CLIP cluster and exactly one CELF1 CLIP cluster. Genes were grouped according to whether the distance between motifs is less than or greater than 50 base pairs (bp). Significance was assessed by rank-sum test. (E) Expression change during heart development (adult versus E17) for transcripts with varying numbers of MBNL1 and CELF1 CLIP clusters. Genes were grouped according to the relative abundance of MBNL1 and CELF1 CLIP clusters and by the presence/absence of a proximal MBNL1/CELF1 binding pair. Only transcripts with gene expression MZ scores >0.5 were included in this analysis, and significance was assessed by KS test. See also Supplemental Figures S7 and S8 and Supplemental Tables S7 and S8. (F) MBNL1 presence does not affect in vitro binding of CELF1 to RNA. 130-nM tagged CELF1 and 250-nM MBNL1 were equilibrated in vitro with random RNA 40mers in an RNA Bind-n-Seq experiment. The tagged CELF1 was pulled down, bound 40mers were eluted and sequenced, and RBNS R of each 6mer was calculated as the frequency in the pulldown library divided by the frequency in the input library. 6mers were classified as weak, medium, or strong (RBNS R Z-score between 1–2, 2–3, or >3, respectively), CELF1-binding, MBNL-binding, or none of the above (“Other”) using the data from Lambert et al. (2014) and color-coded as indicated.
Figure 6.
Figure 6.
Functional antagonism model of effects of CELF and MBNL proteins on mRNA fates. (A) Summary of known nonsplicing activities: CELF1 binding to 3′ UTRs promotes mRNA deadenylation and decay (Vlasova and Bohjanen 2008), while MBNL1 binding to 3′ UTRs promotes localization to membrane compartments (Wang et al. 2012). (B) Binding of both proteins to the same mRNA is expected to result in a functional tug-of-war. For mRNAs containing distal MBNL and CELF binding sites, MBNL promotes targeting of the mRNA for localization and stabilization, while CELF binding promotes decay. For mRNAs containing proximal MBNL and CELF binding sites, CELF1 may directly antagonize MBNL1 function, e.g., by preventing recruitment of complexes associated with localization or inhibiting their function.

Similar articles

Cited by

References

    1. Adereth Y, Dammai V, Kose N, Li R, Hsu T. 2005. RNA-dependent integrin α3 protein localization regulated by the Muscleblind-like protein MLP1. Nat Cell Biol 7: 1240–1247. - PMC - PubMed
    1. Andelfinger G, Tapper AR, Welch RC, Vanoye RC, Vanoye CG, George AL Jr, Benson DW. 2002. KCNJ2 mutation results in Andersen syndrome with sex-specific cardiac and skeletal muscle phenotypes. Am J Hum Genet 71: 663–668. - PMC - PubMed
    1. Barreau C, Paillard L, Mereau A, Osborne HB. 2006. Mammalian CELF/Bruno-like RNA-binding proteins: molecular characteristics and biological functions. Biochimie 88: 515–525. - PubMed
    1. Birk E, Har-Zahav A, Manzini CM, Pasmanik-Chor M, Kornreich L, Walsh CA, Noben-Trauth K, Albin A, Simon AJ, Colleaux L, et al. 2010. SOBP is mutated in syndromic and nonsyndromic intellectual disability and is highly expressed in the brain limbic system. Am J Hum Genet 87: 694–700. - PMC - PubMed
    1. Charlet BN, Logan P, Singh G, Cooper TA. 2002. Dynamic antagonism between ETR-3 and PTB regulates cell type-specific alternative splicing. Mol Cell 9: 649–658. - PubMed

Publication types

MeSH terms

Associated data