. 2015 Jun;25(6):884-96.
doi: 10.1101/gr.185371.114. Epub 2015 Apr 16.

Widespread exon skipping triggers degradation by nuclear RNA surveillance in fission yeast

Affiliations

Widespread exon skipping triggers degradation by nuclear RNA surveillance in fission yeast

Danny A Bitton et al. Genome Res. 2015 Jun.

Abstract

Exon skipping is considered a principal mechanism by which eukaryotic cells expand their transcriptome and proteome repertoires, creating different splice variants with distinct cellular functions. Here we analyze RNA-seq data from 116 transcriptomes in fission yeast (Schizosaccharomyces pombe), covering multiple physiological conditions as well as transcriptional and RNA processing mutants. We applied brute-force algorithms to detect all possible exon-skipping events, which were widespread but rare compared to normal splicing events. Exon-skipping events increased in cells deficient for the nuclear exosome or the 5'-3' exonuclease Dhp1, and also at late stages of meiotic differentiation when nuclear-exosome transcripts decreased. The pervasive exon-skipping transcripts were stochastic, did not increase in specific physiological conditions, and were mostly present at less than one copy per cell, even in the absence of nuclear RNA surveillance and during late meiosis. These exon-skipping transcripts are therefore unlikely to be functional and may reflect splicing errors that are actively removed by nuclear RNA surveillance. The average splicing rate by exon skipping was ∼ 0.24% in wild type and ∼ 1.75% in nuclear exonuclease mutants. We also detected approximately 250 circular RNAs derived from single or multiple exons. These circular RNAs were rare and stochastic, although a few became stabilized during quiescence and in splicing mutants. Using an exhaustive search algorithm, we also uncovered thousands of previously unknown splice sites, indicating pervasive splicing; yet most of these splicing variants were cryptic and increased in nuclear degradation mutants. This study highlights widespread but low frequency alternative or aberrant splicing events that are targeted by nuclear RNA surveillance.


Figures

Figure 1.
Figure 1.
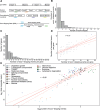
Identification and characterization of exon-skipping events using RNA-seq. (A) Scheme showing pre-mRNA (top) along with all possible normally spliced mRNAs and exon-skipping isoforms. The colored lines below the junctions represent diagnostic reads for normal exon–exon junctions (5′-3′; green, orange, cyan), and for exon-skipping junctions (5′-3′; blue, purple, light green). These diagnostic reads were used to calculate the exon-skipping ratio (ESR) and to identify splice isoforms. (B) Total number of exon-skipping events (y-axis) as a function of number of exons being skipped (x-axis; ranging from one to 12 skipped exons during a single event); 2574 skipping events are shown. (C) Maximum number of exon-skipping events recorded per gene (x-axis) as a function of gene number (y-axis). (D) Correlation between numbers of exon-skipping events per gene and numbers of annotated exons in the same gene. In total, 1063 genes were binned based on number of detected exon-skipping events and number of their annotated exons. The size of data points was scaled according to number of genes in each bin, i.e., normalized by number of genes in the genome containing a corresponding number of exons; (r) Pearson's correlation coefficient; (red line) fitted regression; (dotted red lines) 0.95 confidence levels. (E) Correlation between sequencing depth and number of exon-skipping events. Strains were grouped and color coded according to cellular function or condition tested (Supplemental Table S1); (r) Pearson's correlation coefficient; (red line) fitted regression; (dotted red lines) 0.95 confidence levels.
Figure 2.
Figure 2.
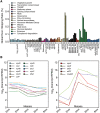
Exon-skipping events are rare but accumulate in nuclear surveillance mutants and meiosis. (A) Sample-specific global exon-skipping ratio (ESR), reflecting the proportion of exon-skipping reads among total exon–exon junction reads. Physiological conditions or mutants as indicated below were grouped and color coded according to cellular function or condition tested (Supplemental Table S1). (B) RNA-seq expression profiles of selected transcripts during meiotic differentiation. (Left) Exosome subunit and nuclear exonuclease transcripts. (Right) Selected transcripts known to increase during meiosis (Mata et al. 2002). Mean expression of two biological replicates is shown at each time point (RPKM, reads per kilobase per million). The decrease in nuclear-exosome transcripts is significant (P-adjust < 0.05, DESeq) (Anders and Huber 2010).
Figure 3.
Figure 3.
Splice variant-specific, local exon-skipping ratios (ESR) highlighting the stochastic nature of exon skipping. (A) Heatmap representing 2504 exon-skipping events for which both normal splicing and exon-skipping reads were identified in one or more samples (ratios provided in Supplemental Table S4). Physiological conditions or mutants as indicated below were grouped and color coded according to cellular function or condition tested. Maximum distance between rows (exon-skipping events) was determined using the “dist” function in R (method “maximum”), followed by hierarchical clustering using the “hclust” function. Row Z-score: Ratios in each row were scaled by subtracting the mean of the row from each value, followed by division of resultant values by the SD of the row, i.e., (local ESR value − row mean)/row SD. (B) As in A but showing local ESR for the high confidence set (111 exon-skipping events supported by nine or more exon-skipping reads in one or more samples). Only 107 exon-skipping events for which both normal and exon-skipping reads were identified in one or more samples are shown (Supplemental Table S5).
Figure 4.
Figure 4.
Splicing errors by exon skipping are eliminated by nuclear RNA surveillance. (A) Average splicing error for a given sample. Set of 2504 exon-skipping events for which both normal splicing and exon-skipping reads were identified in one or more samples. The splicing error rate for a locus is equal to corresponding local ESR (Supplemental Table S4). The values shown are averages of all local ESRs in a sample (Supplemental Table S7). Physiological conditions or mutants as indicated below were grouped and color coded according to cellular function or condition tested (Supplemental Table S1). (B) Number of aberrantly spliced transcripts per cell. To estimate this number, we multiplied local ESR for each exon-skipping event by corresponding transcript copy number (Supplemental Tables S8; Marguerat et al. 2012). Absolute cellular numbers of transcripts from growing cells were used as the gold standard for all samples, except for quiescence, where reported absolute numbers were used. Each blue point represents the copy number of an aberrantly spliced transcript. To avoid log2 of zero, exon-skipping events with local ESR/splicing error of zero were removed. Strains as indicated in A.
Figure 5.
Figure 5.
Analysis of circular exonic RNAs. (A) Scheme showing normal, exon-skipping, and circRNA transcripts. The colored lines below the junctions represent diagnostic reads for normal splice junctions (green, orange, cyan), exon-skipping junctions (purple), and circular junctions (red). These diagnostic reads were used to calculate global circular to total junction ratios and local circular to normal junction ratios used in BD. (B) Global circular to total junction ratios across samples, reflecting the proportion of circRNA reads among total (normal and exon-skipping) junction reads. Physiological conditions or mutants as indicated below were grouped and color coded according to cellular function or condition tested (Supplemental Table S1). Samples were poly(A)-enriched, apart from those marked “T” (total RNA) or “R” (ribosomal depleted). (C) Global exon-skipping ratio compared to circular to total splice junction ratios in all non-poly(A)-enriched samples as indicated. (D) Heatmap for the 21 circRNAs most reproducible in total RNA and ribosomal-depleted samples, with corresponding genes indicated. The global circular to total junction ratio includes exon-skipping reads, whereas the local circular to normal junction ratio excludes exon-skipping reads in any given locus (Supplemental Table S11). Maximum distance between rows (circRNAs) was determined as indicated in Figure 3A.
Figure 6.
Figure 6.
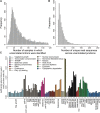
Distribution of novel introns with respect to samples in which they were identified (A) and the sum of their supporting unique read sequences across the unannotated splice junctions (B). A total of 5720 unannotated splicing events are shown. (C) Inefficiently spliced introns accumulate in nuclear surveillance and transcription mutants, meiotic differentiation, and during stationary phase and quiescence. A cutoff of 70 or fewer unique sequences across junctions was applied, resulting in ∼92% (5235/5720) of least efficiently spliced introns (for values in each sample, see Supplemental Table S12). We crudely separated potentially novel introns from cryptic introns by applying an arbitrary threshold (more than 70 unique sequences across the junction; 485/5720 putative novel introns). Ratios of sample-specific inefficiently spliced intron reads to total junction reads are shown, reflecting the proportion of exon–exon reads of inefficiently spliced introns among total exon–exon junction reads. Physiological conditions or mutants as indicated below were grouped and color coded according to cellular function or condition tested (Supplemental Table S1).

Similar articles

Cited by

References

    1. Alexander R, Beggs JD. 2010. Cross-talk in transcription, splicing and chromatin: who makes the first call? Biochem Soc Trans 38: 1251–1256. - PubMed
    1. Anders S, Huber W. 2010. Differential expression analysis for sequence count data. Genome Biol 11: R106. - PMC - PubMed
    1. Anderson JS, Parker RP. 1998. The 3′ to 5′ degradation of yeast mRNAs is a general mechanism for mRNA turnover that requires the SKI2 DEVH box protein and 3′ to 5′ exonucleases of the exosome complex. EMBO J 17: 1497–1506. - PMC - PubMed
    1. Arribas-Layton M, Wu D, Lykke-Andersen J, Song H. 2013. Structural and functional control of the eukaryotic mRNA decapping machinery. Biochim Biophys Acta 1829: 580–589. - PMC - PubMed
    1. Ashwal-Fluss R, Meyer M, Pamudurti NR, Ivanov A, Bartok O, Hanan M, Evantal N, Memczak S, Rajewsky N, Kadener S. 2014. circRNA biogenesis competes with pre-mRNA splicing. Mol Cell 56: 55–66. - PubMed

Publication types