. 2015 Apr 2:6:234.
doi: 10.3389/fmicb.2015.00234. eCollection 2015.

Gene expression patterns and dynamics of the colonization of common bean (Phaseolus vulgaris L.) by highly virulent and weakly virulent strains of Fusarium oxysporum

Affiliations

Gene expression patterns and dynamics of the colonization of common bean (Phaseolus vulgaris L.) by highly virulent and weakly virulent strains of Fusarium oxysporum

Jonathan Niño-Sánchez et al. Front Microbiol. .

Abstract

The dynamics of root and hypocotyl colonization, and the gene expression patterns of several fungal virulence factors and plant defense factors have been analyzed and compared in the interaction of two Fusarium oxysporum f. sp. phaseoli strains displaying clear differences in virulence, with a susceptible common bean cultivar. The growth of the two strains on the root surface and the colonization of the root was quantitatively similar although the highly virulent (HV) strain was more efficient reaching the central root cylinder. The main differences between both strains were found in the temporal and spatial dynamics of crown root and hypocotyl colonization. The increase of fungal biomass in the crown root was considerably larger for the HV strain, which, after an initial stage of global colonization of both the vascular cylinder and the parenchymal cells, restricted its growth to the newly differentiated xylem vessels. The weakly virulent (WV) strain was a much slower and less efficient colonizer of the xylem vessels, showing also growth in the intercellular spaces of the parenchyma. Most of the virulence genes analyzed showed similar expression patterns in both strains, except SIX1, SIX6 and the gene encoding the transcription factor FTF1, which were highly upregulated in root crown and hypocotyl. The response induced in the infected plant showed interesting differences for both strains. The WV strain induced an early and strong transcription of the PR1 gene, involved in SAR response, while the HV strain preferentially induced the early expression of the ethylene responsive factor ERF2.

Keywords: Fusarium oxysporum; Phaseolus vulgaris; confocal microscopy; effector; virulence.


Figures
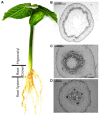
FIGURE 1
FIGURE 1
Common bean plant (Phaseolus vulgaris L.) and histological structure of the plant regions analyzed in the present study. (A) Common bean plant grown in hydroponic culture. (B–D) Cross sections of the three plant regions analyzed in the present study showing the definitive architecture of the xylem and phloem vessels in the hypocotyl (B), the primordial rings of xylem and phloem vessels in the root crown (C) and the undifferentiated central cylinder in the tap root (D). Plant sections were fixed, embedded in paraffin and stained with toluidine blue for microscopic examination.
FIGURE 2
FIGURE 2
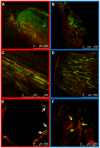
External colonization of the root system by highly virulent (HV; FOP-SP1) and weakly virulent (WV; FOP-SP4) Fusarium oxysporum f. sp. phaseoli strains. Colonization of the taproot and lateral roots of plants inoculated with the HV strain FOP-SP1 (red framed images) and the WV strain FOP-SP4 (blue framed images) was visualized by confocal laser scanning microscopy 1–3 days post inoculation (dpi). (A–C) FOP-SP1 mycelium growing in the junction of a lateral root with the taproot. (D–F) FOP-SP4 mycelium growing in an interstitial zone of a lateral root. Intermediate root zones showing epidermis colonization by FOP-SP1 hyphae (G–I) and FOP-SP4 hyphae (J–L).
FIGURE 3
FIGURE 3
Internal colonization of the root system by HV (FOP-SP1) and WV (FOP-SP4) F. oxysporum f. sp. phaseoli strains. Mycelial growth of FOP-SP1 and FOP-SP4 inside the taproot was visualized in longitudinal sections (A,B) and cross sections (C–F) of infected plants 1–3 dpi. The arrows indicate hyphae of FOP-SP1 growing inside the vessels of the central cylinder of the taproot (red framed images) and hyphae of FOP-SP4 colonizing the cortex of the taproot (blue framed images).
FIGURE 4
FIGURE 4
Colonization of the root crown by HV (FOP-SP1) and WV (FOP-SP4) F. oxysporum f. sp. phaseoli strains. The growth of mycelium of FOP-SP1 and FOP-SP4 in the root crown region was visualized in longitudinal sections (A–D) and cross sections (E,F) of plants at 5–7 dpi. The hyphae of FOP-SP1 heavily colonized the cortex (A) and the xylem vessels (C and white arrows in E) of the root crown. The growth of hyphae of FOP-SP4 in the root crown predominantly occurred along the interstitial spaces of cortical cells (B,D) although some hyphae also colonized the xylem vessels (yellow arrows in F).
FIGURE 5
FIGURE 5
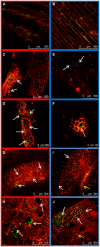
Colonization of the hypocotyl by HV (FOP-SP1) and WV (FOP-SP4) F. oxysporum f. sp. phaseoli strains. The growth of mycelium of FOP-SP1 (red framed images) and FOP-SP4 (blue framed images) was visualized in longitudinal sections (A,B) and cross sections (C–J). Hyphae of FOP-SP1 were detected growing inside the xylem vessels almost exclusively (arrows) at 10 dpi (A), 14 dpi (C,D), and 21 dpi (G,H). Hyphae of FOP-SP4 were mainly detected growing along the cells of cortex and parenchyma (white arrows), at 10 dpi (B), 14 dpi (E,F) and 21 dpi (I,J), although some hyphae were also seen inside the xylem vessels (yellow arrows).
FIGURE 6
FIGURE 6
Quantification of fungal biomass in P. vulgaris plants colonized by HV and WV strains of F. oxysporum f. sp. phaseoli. FOP-SP4 DNA (blue bars) or FOP-SP1 DNA (red bars) relative to that of common bean was measured by assaying the fungal FTF2 gene and the plant actin gene by RT-qPCR using DNA extracted from the root system at 1, 2, and 3 dpi (RS1, RS2, and RS3), root crown at 5 and 7 dpi (C5 and C7) and hypocotyl at 14 and 21 dpi (H14 and H21). All measurements were referred to the value obtained for FOP-SP4 colonization at RS1 (arbitrary value of 1.0). Significative differences were observed for C5 (**p < 0.01), C7 (p < 0.05), and H21 (∗∗∗p < 0.001).
FIGURE 7
FIGURE 7
Quantitative reverse transcription polymerase chain reaction (RT-qPCR) analysis of time-course expression of eleven fungal genes in P. vulgaris plants colonized by HV and WV strains of F. oxysporum f. sp. phaseoli. The plant regions assayed and the time intervals after inoculation are indicated in the center of the figure: root system at 1, 2, and 3 dpi (RS1, RS2, ans RS3, respectively); root crown at 5 and 7 dpi (C5 and C7, respectively); and hypocotyl at 14 and 21 dpi (H14 and H21, respectively). The bars on the left show the results obtained in common bean plants colonized by the WV strain (FOP-SP4). The bars on the right show the corresponding results for plants colonized by the HV strain (FOP-SP1). The expression ratios were normalized by using the fungal EF1α gene as an endogenous control. An arbitrary value of 1.0 was denoted for the transcript level of each gene in plants colonized by the WV strain at RS1, except for the FTF1, SIX1, and SIX6 transcripts whose 1.0 values correspond to the transcript level of each gene in plants colonized by the HV strain at RS1. The results shown are the averages and their respective standard deviations obtained in three independent biological experiments. The expression level value differences between each pair of samples (the expression of the same gene in plants colonized by the HV strain or the WV strain) were tested using the t-test and indicated by (*p < 0.05) and (***p < 0.001).
FIGURE 8
FIGURE 8
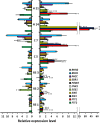
Quantitative reverse transcription polymerase chain reaction analysis of time-course expression of common bean genes involved in the defense response in plants colonized by HV and WV strains of F. oxysporum f. sp. phaseoli. The plant regions assayed and the time intervals after inoculation are indicated in the X axis: root system at 1, 2, and 3 dpi (RS1, RS2, and RS3, respectively); root crown at 5 and 7 dpi (C5 and C7, respectively); and hypocotyl at 14 and 21 dpi (H14 and H21, respectively). The relative expression measurements in the Y axis are indicated in a logarithmic scale. Dark bars for each color indicate expression of the corresponding gene in plants colonized by the WV strain, and light bars indicate expression of the corresponding gene in plants colonized by the HV strain. The expression ratios were normalized by using the common bean actin gene as endogenous control. The levels of expression for a pair of measurements (dark and light bars) were tested using the t-test and significative differences (p < 0.05) indicated by .
FIGURE 9
FIGURE 9
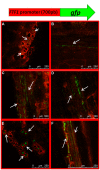
Dynamics of plant colonization by a FOP-SP1 transformant expressing the GFP gene under the control of the FTF1 promoter (PFTF1::GFP). The transgene expressed in the transformant PFTF1::GFP is schematically depicted at the top of the figure. Arrows indicate mycelial growth as visualized in cross sections (A,E) and longitudinal sections (B–D,F) of root crown at 7 dpi (A) and hypocotyl at 10 dpi (B), 14 dpi (C,D) and 21 dpi (E,F).

References

    1. Alves-Santos F. A., Cordeiro-Rodrigues L., Sayagués J. M., Martín-Domínguez R., García-Benavides P., Crespo M. C., et al. (2002a). Pathogenicity and race characterization of Fusarium oxysporum f. sp. phaseoli isolates from Spain and Greece. Plant Pathol. 51 605–611 10.1046/j.1365-3059.2002.00745.x - DOI
    1. Alves-Santos F. M., Ramos B., García-Sánchez M. A., Eslava A. P., Díaz-Mínguez J. M. (2002b). A DNA-based procedure for in planta detection of Fusarium oxysporum f. sp. phaseoli. Phytopathology 92 237–244 10.1094/PHYTO.2002.92.3.237 - DOI - PubMed
    1. Alves-Santos F. M., Benito E. P., Eslava A. P., Díaz-Mínguez J. M. (1999). Genetic diversity of Fusarium oxysporum strains from common bean fields in Spain. Appl. Environ. Microbiol. 65 3335–3340. - PMC - PubMed
    1. Armstrong G. M., Armstrong J. K. (1975). Reflections on the wilt fusaria. Annu. Rev. Phytopathol. 13 95–103 10.1146/annurev.py.13.090175.000523 - DOI
    1. Berrocal-Lobo M., Molina A. (2008). Arabidopsis defense response againstFusarium oxysporum. Trends Plant Sci. 13 145–150 10.1016/j.tplants.2007.12.004 - DOI - PubMed

LinkOut - more resources