

PVT1: a rising star among oncogenic long noncoding RNAs
- PMID: 25883951
- PMCID: PMC4391155
- DOI: 10.1155/2015/304208
PVT1: a rising star among oncogenic long noncoding RNAs
Abstract
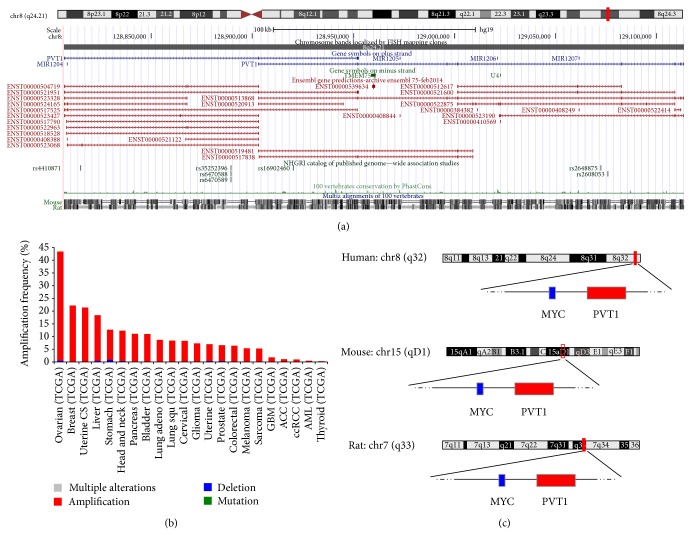
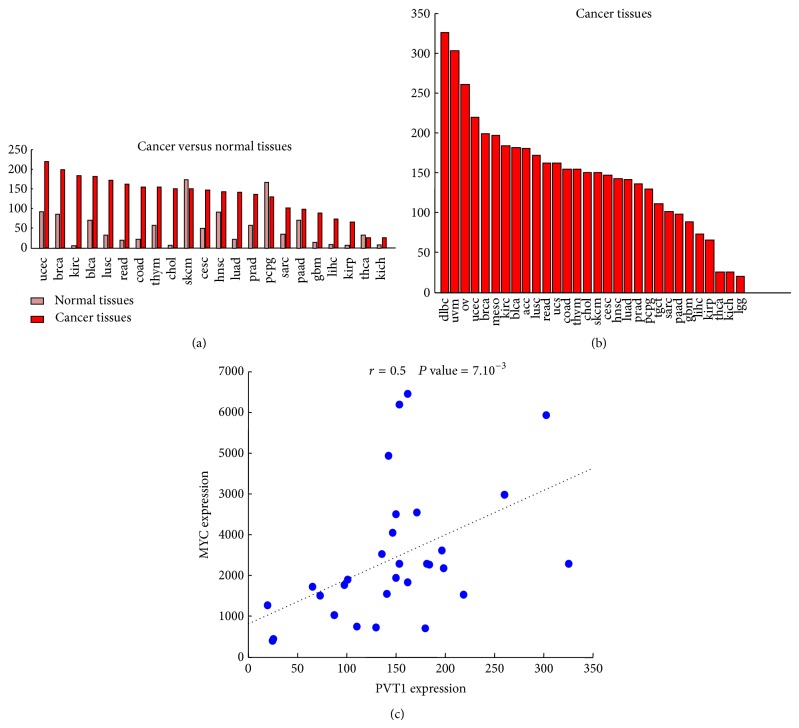
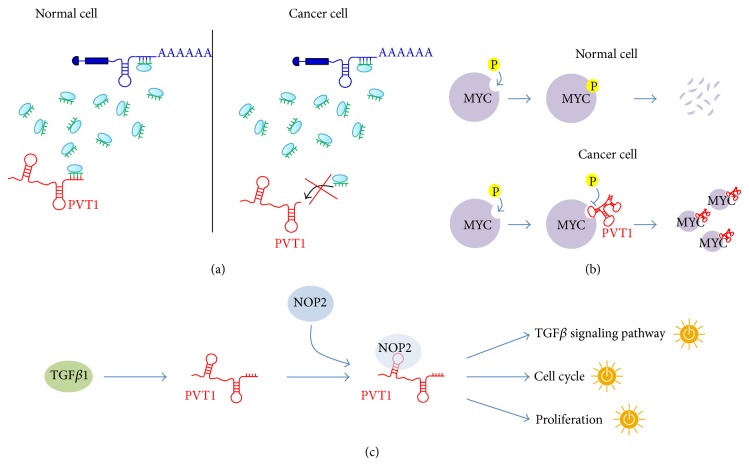
It is becoming increasingly clear that short and long noncoding RNAs critically participate in the regulation of cell growth, differentiation, and (mis)function. However, while the functional characterization of short non-coding RNAs has been reaching maturity, there is still a paucity of well characterized long noncoding RNAs, even though large studies in recent years are rapidly increasing the number of annotated ones. The long noncoding RNA PVT1 is encoded by a gene that has been long known since it resides in the well-known cancer risk region 8q24. However, a couple of accidental concurrent conditions have slowed down the study of this gene, that is, a preconception on the primacy of the protein-coding over noncoding RNAs and the prevalent interest in its neighbor MYC oncogene. Recent studies have brought PVT1 under the spotlight suggesting interesting models of functioning, such as competing endogenous RNA activity and regulation of protein stability of important oncogenes, primarily of the MYC oncogene. Despite some advancements in modelling the PVT1 role in cancer, there are many questions that remain unanswered concerning the precise molecular mechanisms underlying its functioning.
Figures


Similar articles
-
PVT1 dependence in cancer with MYC copy-number increase.Nature. 2014 Aug 7;512(7512):82-6. doi: 10.1038/nature13311. Epub 2014 Jun 22. Nature. 2014. PMID: 25043044 Free PMC article.
-
Long non-coding RNA PVT1 and cancer.Biochem Biophys Res Commun. 2016 Feb 26;471(1):10-4. doi: 10.1016/j.bbrc.2015.12.101. Epub 2016 Feb 3. Biochem Biophys Res Commun. 2016. PMID: 26850852 Review.
-
Amplification and the clinical significance of circulating cell-free DNA of PVT1 in breast cancer.Oncol Rep. 2017 Jul;38(1):465-471. doi: 10.3892/or.2017.5650. Epub 2017 May 18. Oncol Rep. 2017. PMID: 28534994
-
Expanding the functional role of long noncoding RNAs.Cell Res. 2014 Nov;24(11):1284-5. doi: 10.1038/cr.2014.104. Epub 2014 Aug 8. Cell Res. 2014. PMID: 25104732 Free PMC article.
-
The long noncoding RNA regulation at the MYC locus.Curr Opin Genet Dev. 2015 Aug;33:41-8. doi: 10.1016/j.gde.2015.07.001. Epub 2015 Aug 7. Curr Opin Genet Dev. 2015. PMID: 26254776 Review.
Cited by
-
Advances in Understanding the LncRNA-Mediated Regulation of the Hippo Pathway in Cancer.Onco Targets Ther. 2021 Apr 7;14:2397-2415. doi: 10.2147/OTT.S283157. eCollection 2021. Onco Targets Ther. 2021. PMID: 33854336 Free PMC article. Review.
-
Transcription regulation by long non-coding RNAs: mechanisms and disease relevance.Nat Rev Mol Cell Biol. 2024 May;25(5):396-415. doi: 10.1038/s41580-023-00694-9. Epub 2024 Jan 19. Nat Rev Mol Cell Biol. 2024. PMID: 38242953 Free PMC article. Review.
-
Long Non-coding RNAs: Regulators of the Activity of Myeloid-Derived Suppressor Cells.Front Immunol. 2019 Jul 25;10:1734. doi: 10.3389/fimmu.2019.01734. eCollection 2019. Front Immunol. 2019. PMID: 31404149 Free PMC article. Review.
-
Natural Antisense Transcripts: Molecular Mechanisms and Implications in Breast Cancers.Int J Mol Sci. 2018 Jan 2;19(1):123. doi: 10.3390/ijms19010123. Int J Mol Sci. 2018. PMID: 29301303 Free PMC article. Review.
-
The Oncogenic Potential of the Centromeric Border Protein FAM84B of the 8q24.21 Gene Desert.Genes (Basel). 2020 Mar 15;11(3):312. doi: 10.3390/genes11030312. Genes (Basel). 2020. PMID: 32183428 Free PMC article. Review.
References
Publication types
MeSH terms
Substances
LinkOut - more resources
Full Text Sources
Other Literature Sources
