Antidiabetic and renoprotective effects of Cladophora glomerata Kützing extract in experimental type 2 diabetic rats: a potential nutraceutical product for diabetic nephropathy
- PMID: 25883984
- PMCID: PMC4391723
- DOI: 10.1155/2015/320167
Antidiabetic and renoprotective effects of Cladophora glomerata Kützing extract in experimental type 2 diabetic rats: a potential nutraceutical product for diabetic nephropathy
Abstract
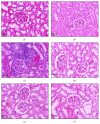
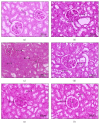
Cladophora glomerata extract (CGE) has been shown to exhibit antigastric ulcer, anti-inflammatory, analgesic, hypotensive, and antioxidant activities. The present study investigated antidiabetic and renoprotective effects of CGE in type 2 diabetes mellitus (T2DM) rats. The rats were induced by high-fat diet and streptozotocin and supplemented daily with 1 g/kg BW of CGE for 12 weeks. The renal transport function was assessed by the uptake of para-aminohippurate mediated organic anion transporters 1 (Oat1) and 3 (Oat3), using renal cortical slices. These two transporters were known to be upregulated by insulin and PKCζ while they were downregulated by PKCα activation. Compared to T2DM, CGE supplemented rats had significantly improved hyperglycaemia, hypertriglyceridemia, insulin resistance, and renal morphology. The baseline uptake of para-aminohippurate was not different among experimental groups and was correlated with Oat1 and 3 mRNA expressions. Nevertheless, while insulin-stimulated Oat1 and 3 functions in renal slices were blunted in T2DM rats, they were improved by CGE supplementation. The mechanism of CGE-restored insulin-stimulated Oat1 and 3 functions was clearly shown to be associated with upregulated PKCζ and downregulated PKCα expressions and activations. These findings indicate that CGE has antidiabetic effect and suggest it may prevent diabetic nephropathy through PKCs in a T2DM rat model.
Figures


Similar articles
-
Cladophora glomerata Kützing extract exhibits antioxidant, anti-inflammation, and anti-nitrosative stress against impairment of renal organic anion transport in an in vivo study.Nutr Res Pract. 2024 Oct;18(5):633-646. doi: 10.4162/nrp.2024.18.5.633. Epub 2024 Jul 19. Nutr Res Pract. 2024. PMID: 39398884 Free PMC article.
-
Antioxidant and renoprotective effects of Spirogyra neglecta (Hassall) Kützing extract in experimental type 2 diabetic rats.Biomed Res Int. 2013;2013:820786. doi: 10.1155/2013/820786. Epub 2013 Jun 3. Biomed Res Int. 2013. PMID: 23862157 Free PMC article.
-
Impaired insulin signaling affects renal organic anion transporter 3 (Oat3) function in streptozotocin-induced diabetic rats.PLoS One. 2014 May 6;9(5):e96236. doi: 10.1371/journal.pone.0096236. eCollection 2014. PLoS One. 2014. Retraction in: PLoS One. 2018 Aug 21;13(8):e0202898. doi: 10.1371/journal.pone.0202898. PMID: 24801871 Free PMC article. Retracted.
-
Impaired renal organic anion transport 1 (SLC22A6) and its regulation following acute myocardial infarction and reperfusion injury in rats.Biochim Biophys Acta Mol Basis Dis. 2019 Sep 1;1865(9):2342-2355. doi: 10.1016/j.bbadis.2019.05.013. Epub 2019 May 21. Biochim Biophys Acta Mol Basis Dis. 2019. PMID: 31125610
-
Antidiabetic Properties of Curcumin II: Evidence from In Vivo Studies.Nutrients. 2019 Dec 25;12(1):58. doi: 10.3390/nu12010058. Nutrients. 2019. PMID: 31881654 Free PMC article. Review.
Cited by
-
Mechanisms of Herbal Nephroprotection in diabetes mellitus.J Diabetes Res. 2020 Jun 30;2020:5710513. doi: 10.1155/2020/5710513. eCollection 2020. J Diabetes Res. 2020. PMID: 32695828 Free PMC article. Review.
-
Tiliacora triandra (Colebr.) Diels Leaf Aqueous Extract Inhibits Hepatic Glucose Production in HepG2 Cells and Type 2 Diabetic Rats.Molecules. 2021 Feb 25;26(5):1239. doi: 10.3390/molecules26051239. Molecules. 2021. PMID: 33669133 Free PMC article.
-
Cladophora glomerata methanolic extract promotes chondrogenic gene expression and cartilage phenotype differentiation in equine adipose-derived mesenchymal stromal stem cells affected by metabolic syndrome.Stem Cell Res Ther. 2019 Dec 17;10(1):392. doi: 10.1186/s13287-019-1499-z. Stem Cell Res Ther. 2019. PMID: 31847882 Free PMC article.
-
Marine and Agro-Industrial By-Products Valorization Intended for Topical Formulations in Wound Healing Applications.Materials (Basel). 2022 May 13;15(10):3507. doi: 10.3390/ma15103507. Materials (Basel). 2022. PMID: 35629534 Free PMC article.
-
DIBc, a nanochelating-based nano metal-organic framework, shows anti-diabetic effects in high-fat diet and streptozotocin-induced diabetic rats.Int J Nanomedicine. 2019 Mar 27;14:2145-2156. doi: 10.2147/IJN.S196050. eCollection 2019. Int J Nanomedicine. 2019. PMID: 30988614 Free PMC article.
References
-
- Peerapornpisal Y., Amornledpison D., Rujjanawate C., Ruangrit K., Kanjanapothi D. Two endemic species of Macroalgae in Nan River, Northern Thailand, as therapeutic agents. Science Asia. 2006;32(supplement 1):71–76.
Publication types
MeSH terms
Substances
LinkOut - more resources
Full Text Sources
Other Literature Sources
Medical

