. 2015 Apr 17:4:e05506.
doi: 10.7554/eLife.05506.

Distinct mechanisms underlie oral vs aboral regeneration in the cnidarian Hydractinia echinata

Affiliations

Distinct mechanisms underlie oral vs aboral regeneration in the cnidarian Hydractinia echinata

Brian Bradshaw et al. Elife. .

Abstract

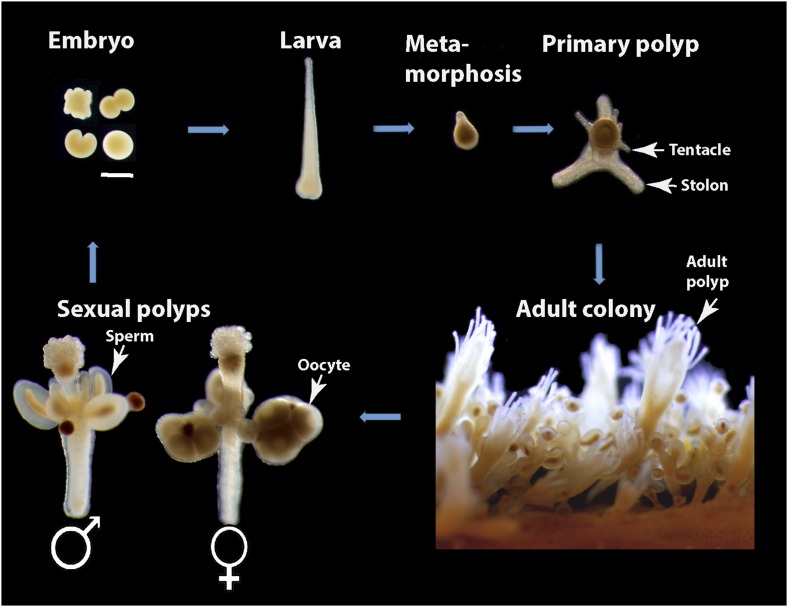
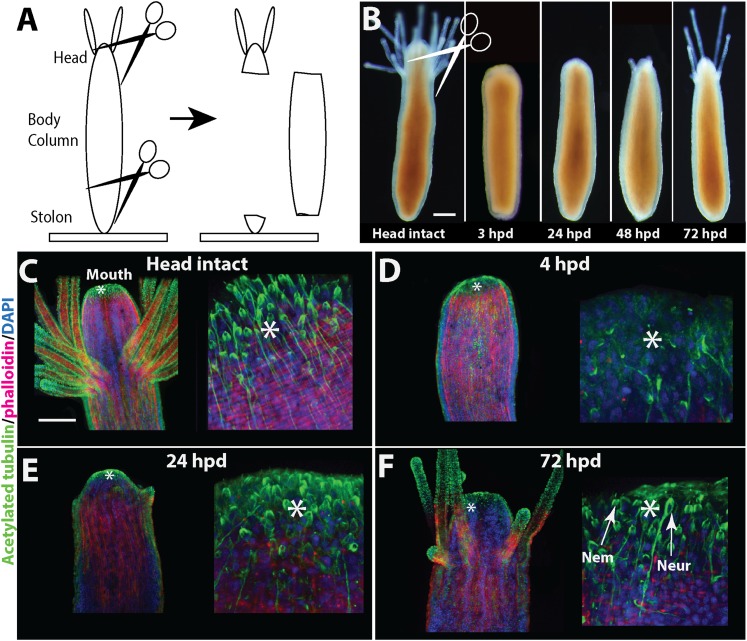
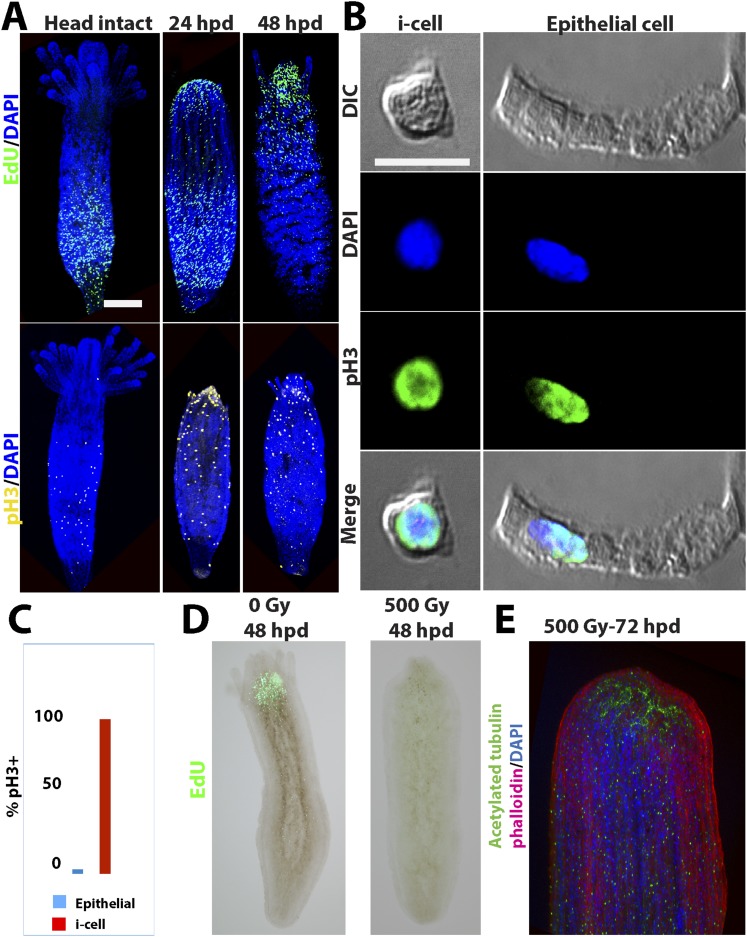
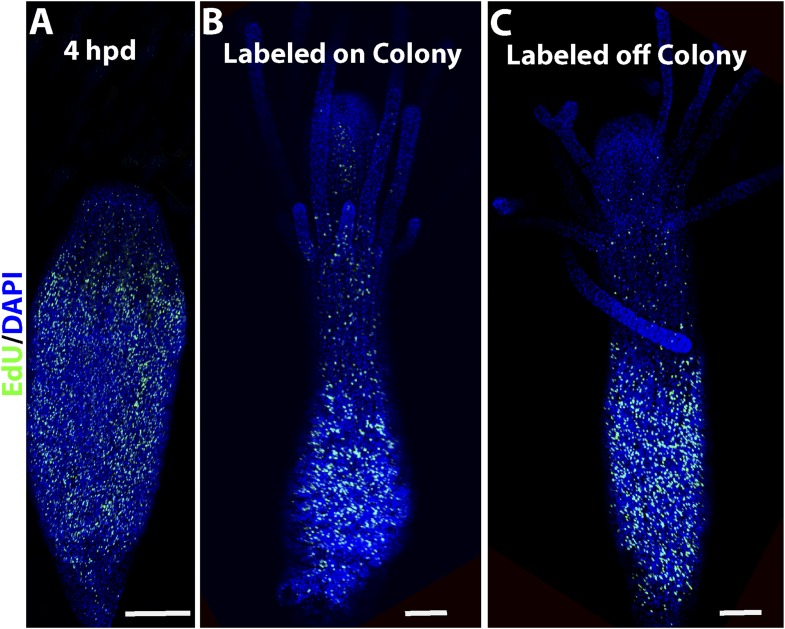
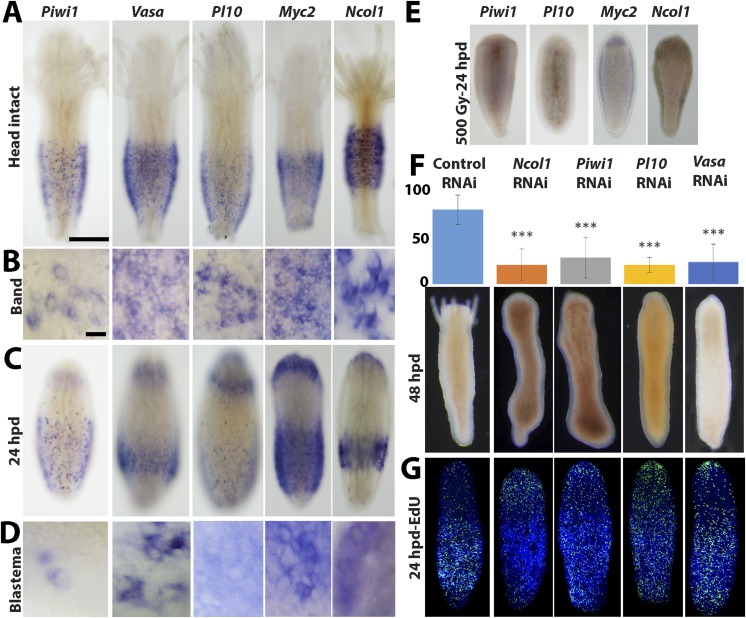
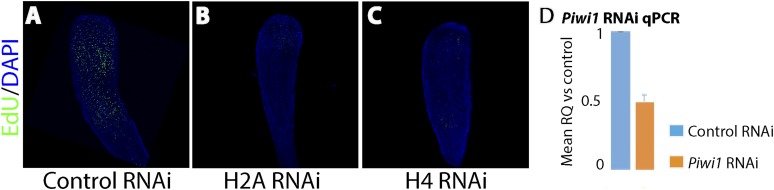
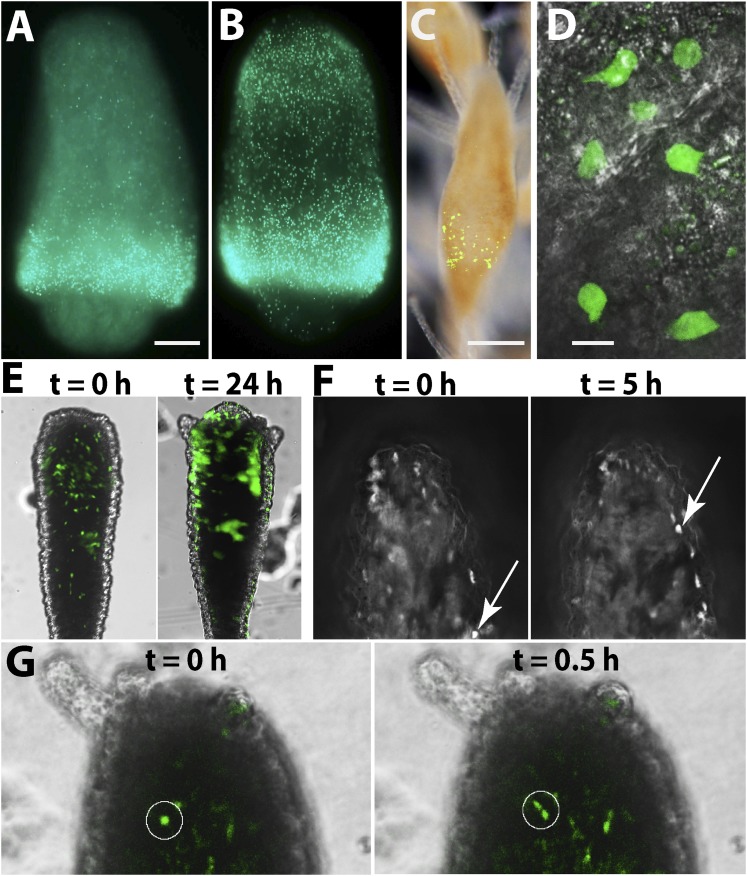
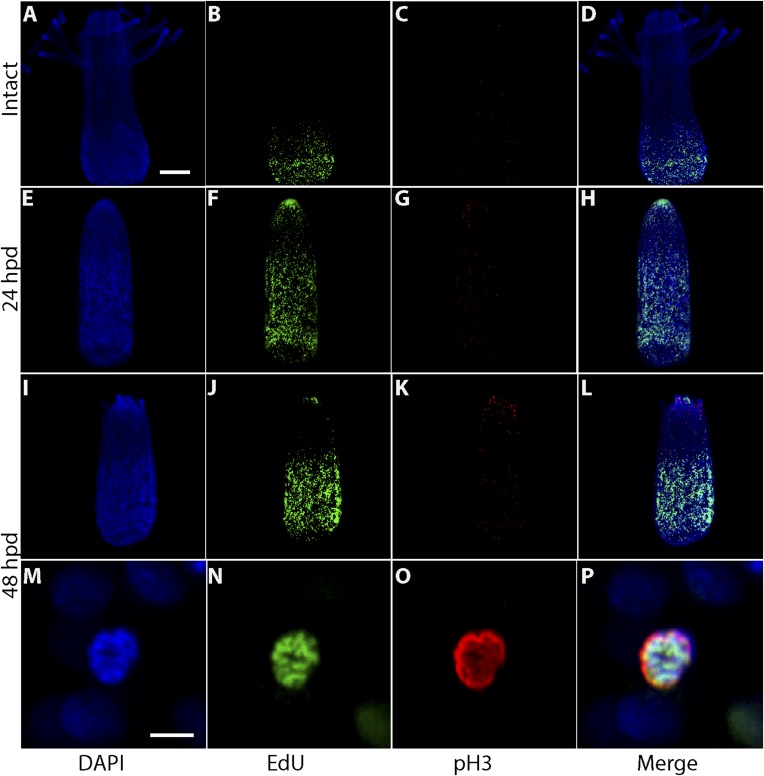
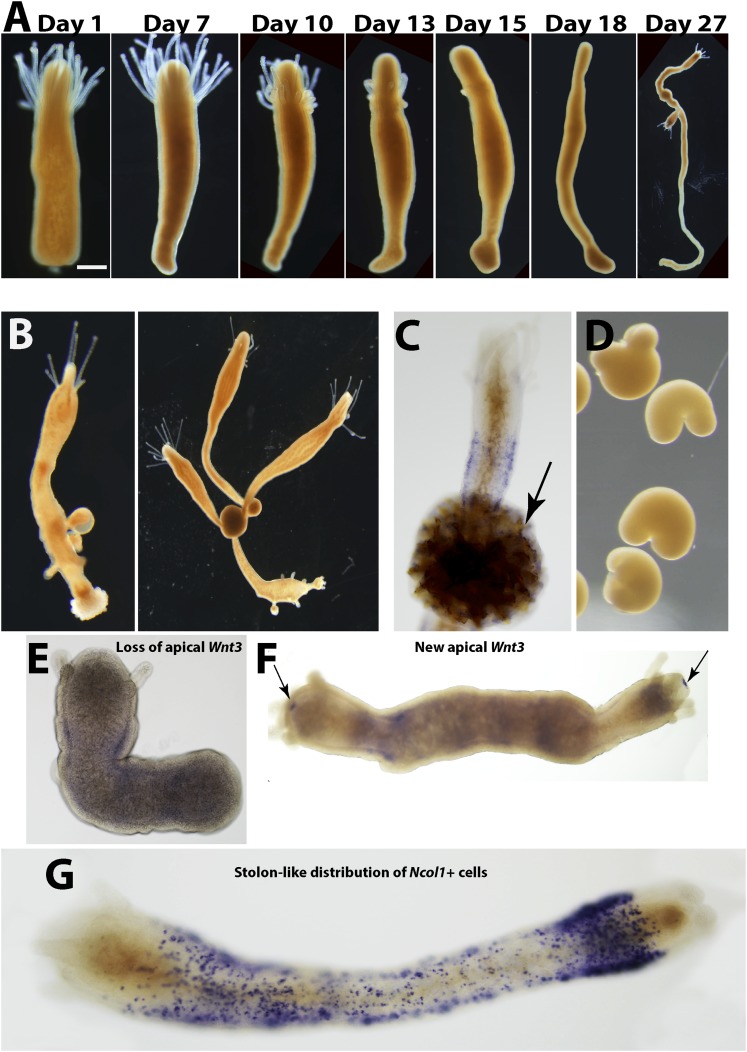
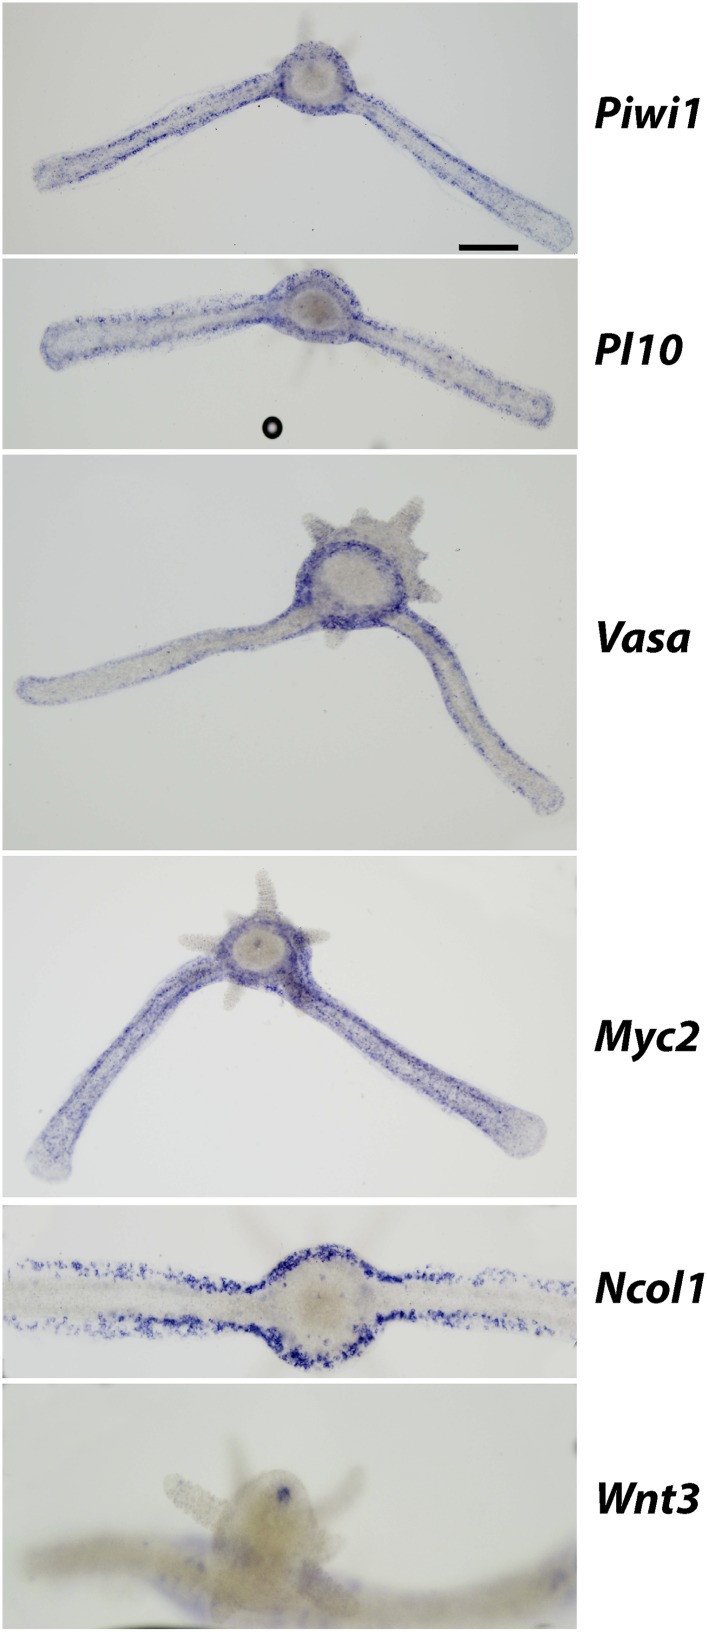
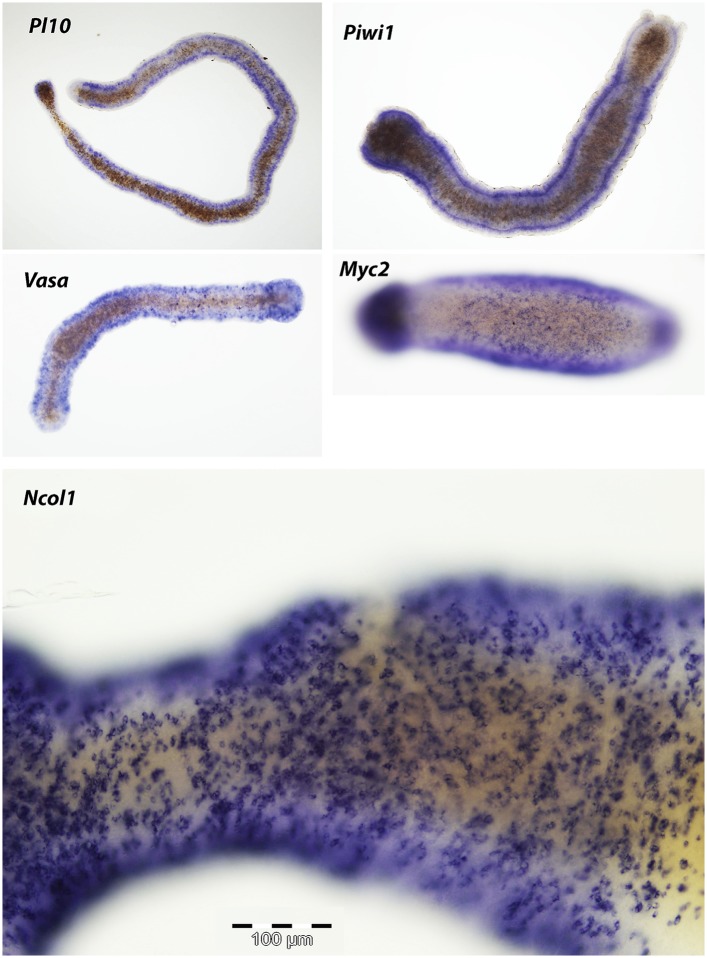
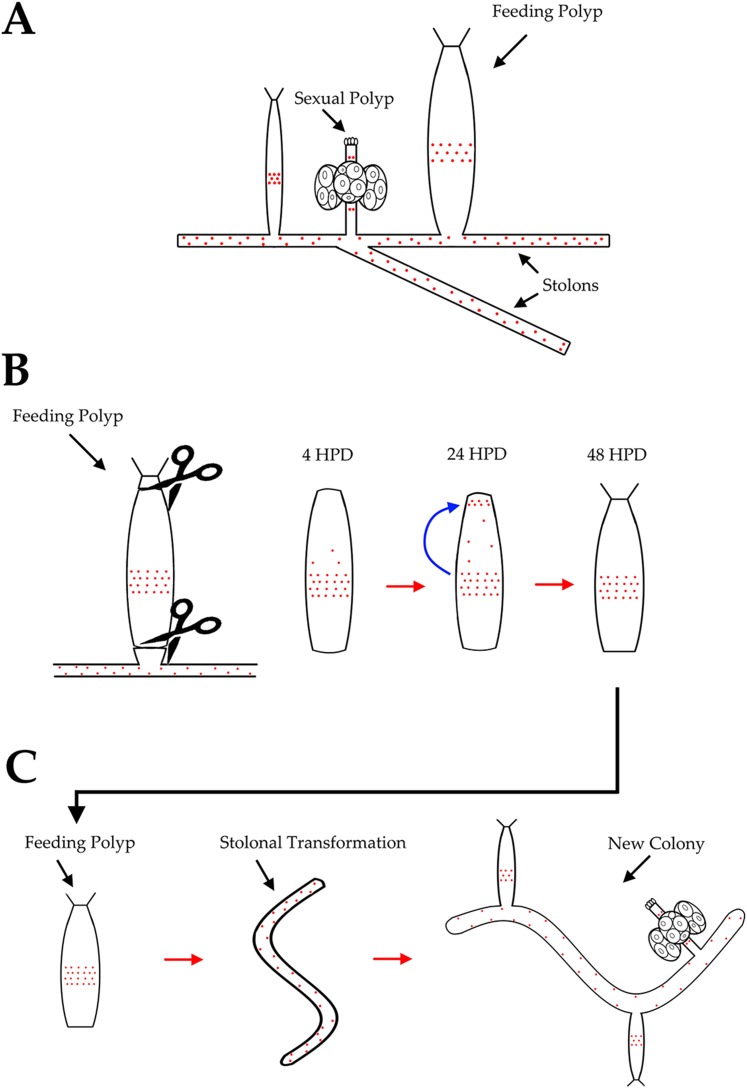
Cnidarians possess remarkable powers of regeneration, but the cellular and molecular mechanisms underlying this capability are unclear. Studying the hydrozoan Hydractinia echinata we show that a burst of stem cell proliferation occurs following decapitation, forming a blastema at the oral pole within 24 hr. This process is necessary for head regeneration. Knocking down Piwi1, Vasa, Pl10 or Ncol1 expressed by blastema cells inhibited regeneration but not blastema formation. EdU pulse-chase experiments and in vivo tracking of individual transgenic Piwi1(+) stem cells showed that the cellular source for blastema formation is migration of stem cells from a remote area. Surprisingly, no blastema developed at the aboral pole after stolon removal. Instead, polyps transformed into stolons and then budded polyps. Hence, distinct mechanisms act to regenerate different body parts in Hydractinia. This model, where stem cell behavior can be monitored in vivo at single cell resolution, offers new insights for regenerative biology.

Keywords: Hydractinia echinata; cnidaria; developmental biology; stem cells.


Conflict of interest statement

The authors declare that no competing interests exist.

Figures

Figure 1.
Figure 1.. Hydractinia life cycle and colony structure.
Scale bar 200 μm. DOI: http://dx.doi.org/10.7554/eLife.05506.003
Figure 2.
Figure 2.. Head regeneration in Hydractinia.
(A) Experimental setup. (B) Live images of regenerating polyp. Scale bar 100 μm. (CF) Anti acetylated tubulin (green)—phalloidin (red)—DAPI (blue) staining of regenerating polyp. Asterisks are depicted at approximately the same position in each panel. (C) Intact polyp. (D) 4 hpd. (E) 24 hpd. (F) 72 hpd. Nem = nematocyte; Neur = neuron. Scale bars 100 μm. DOI: http://dx.doi.org/10.7554/eLife.05506.004
Figure 3.
Figure 3.. Cell proliferation during head regeneration.
(A) EdU (upper panes) and phospho-Histone 3 (pH3) (lower panes) labeling of cells. Scale bar 200 μm. (B) Maceration of animals and labeling of cycling cells. Scale bar 10 μm. (C) Percentages of epithelial and i-cells out of the total mitotic cells. (D) Effect of gamma irradiation on cell proliferation and regeneration. (E) Effect of irradiation on nervous system regeneration. Green, anti-acetylated tubulin; red, phalloidin; blue, DAPI. DOI: http://dx.doi.org/10.7554/eLife.05506.005
Figure 3—figure supplement 1.
Figure 3—figure supplement 1.. EdU labeling of polyps.
(A) S-phase cells during wound closure. (B) S-phase cells in a polyps connected to a colony. (C) S-phase cells in a polyp 24 hr post isolation. Scale bars 200 μm. DOI: http://dx.doi.org/10.7554/eLife.05506.006
Figure 3—figure supplement 2.
Figure 3—figure supplement 2.. A selection of dissociated Hydractinia cells.
DOI: http://dx.doi.org/10.7554/eLife.05506.007
Figure 3—figure supplement 3.
Figure 3—figure supplement 3.. Effect of different absorbed doses of gamma irradiation on head regeneration and cell proliferation.
DOI: http://dx.doi.org/10.7554/eLife.05506.008
Figure 3—figure supplement 4.
Figure 3—figure supplement 4.. TUNEL staining of control and irradiated polyps post decapitation.
DOI: http://dx.doi.org/10.7554/eLife.05506.009
Figure 3—figure supplement 5.
Figure 3—figure supplement 5.. Effect of 30 μM mitomycin C on cell proliferation and head regeneration.
DOI: http://dx.doi.org/10.7554/eLife.05506.010
Figure 4.
Figure 4.. Gene expression during head regeneration.
(A) Expression of i-cell marker genes in intact polyps. Scale bar 200 μm. (B) Higher magnification of positive cells in the band. Scale bar 10 μm. (C) Expression of marker genes 24 hr post decapitation. (D) Higher magnification of blastema cells expressing i-cell marker genes. (E) Effect of gamma irradiation on i-cell marker gene expression. (F and G) Downregulation of marker genes during regeneration by RNAi. (F) Effect on regeneration and quantitative analysis of knockdown. (G) Effect on cell proliferation. DOI: http://dx.doi.org/10.7554/eLife.05506.011
Figure 4—figure supplement 1.
Figure 4—figure supplement 1.. Effect of histones H2A and H4 knockdown and quantification of Piwi1 mRNA following RNAi knockdown.
(A) Control RNAi. (B) Histone H2A RNAi. (C) Histone H4 RNAi. (D) Relative quantity of Piwi1 expression in control vs Piwi1 RNAi. Expression levels are normalized to 18S rRNA. Error bars = SD. DOI: http://dx.doi.org/10.7554/eLife.05506.012
Figure 5.
Figure 5.. The cellular source for head regeneration.
(A and B) EdU pulse-chase. (A) 6 hpd—most EdU+ cells restricted to the band. Scale bar 50 μm. (B) 24 hpd—many EdU+ cells migrated to the blastema. (CG) Live images of Piwi1-GFP+ transgenic cells. (C) Transgenic Piwi1-GFP+ polyp. Scale bar 200 μm. (D) Higher magnification of live GFP+ i-cells in vivo. Scale bar 10 μm. (E) Live transgenic polyp pictured at 10 (left) and 24 (right) hpd. (F) Live images of a single, Piwi1-GFP+ i-cell migrating to the forming blastema (arrow). (G) Live image of a single, Piwi1-GFP+ i-cell dividing during migration (encircled). DOI: http://dx.doi.org/10.7554/eLife.05506.013
Figure 5—figure supplement 1.
Figure 5—figure supplement 1.. Proliferation of migrating cells.
Animals were EdU pulse labeled for 60 min and fixed either intact or at different time points post decapitation. They were then stained with anti-pH3 antibody. (AD) Intact animals. (EH) 24 hpd. (IP) 48 hpd. (AL) represent projections of multiple confocal stacks; (MP) are single confocal sections. Scale bars 100 μm (AL) and 10 μm (MP). DOI: http://dx.doi.org/10.7554/eLife.05506.014
Figure 5—figure supplement 2.
Figure 5—figure supplement 2.. The structure of the construct used to generate transgenic, Piwi1-GFP+ animals.
DOI: http://dx.doi.org/10.7554/eLife.05506.015
Figure 5—figure supplement 3.
Figure 5—figure supplement 3.. Piwi1 immunohistochemistry and co-localization of gene expression and S-phase cells.
(A) Co-staining of anti-Piwi1 antibody staining (green) and DAPI (blue). Scale bar 200 μm. (B) Co-staining of anti-Piwi1 antibody staining (green) and EdU (red). Scale bar 20 μm. (C) Co labeling of Ncol1 (blue) and EdU (green). Scale bar 20 μm. DOI: http://dx.doi.org/10.7554/eLife.05506.016
Figure 6.
Figure 6.. Stolon regeneration.
(A) Time course of a single polyp transforming into a stolon and budding new polyps. Scale bar 200 μm. (B) Sexually mature colonies derived from an isolated polyp. (C) Chitin secretion (arrow) by a polyp that has transformed into a stolon. (D) Early embryos spawned by colony derived from a single polyp. (E) Loss of oral Wnt3 in polyp transforming into a stolon. (F) Oral Wnt3 expression in newly bud polyps (arrows). (G) Stolon-like expression of i-cell markers in transformed polyps. DOI: http://dx.doi.org/10.7554/eLife.05506.019
Figure 6—figure supplement 1.
Figure 6—figure supplement 1.. Expression of i-cell markers in stolons and Wnt3 in a primary polyp.
Colonies are growing on glass cover slips and images are taken from below, except of Wnt3 that was taken from above. Scale bar 100 μm. DOI: http://dx.doi.org/10.7554/eLife.05506.020
Figure 6—figure supplement 2.
Figure 6—figure supplement 2.. Expression of i-cell and nematogenesis markers in polyps that had transformed into stolons.
DOI: http://dx.doi.org/10.7554/eLife.05506.021
Figure 7.
Figure 7.. A summary of Hydractinia regeneration.
Red dots represent proliferating i-cells. (A) A schematic of a normal colony including stolons, feeding and sexual polyps. (B) Head regeneration. Isolation of a polyp from the colony and its decapitation result in migration of i-cells to the head stump but not to the stolon stump. A head blastema, but not stolon blastema, is formed and provides the progenitors for the new head. (C) Transformation of polyps to stolons involves loss of polarity and ubiquitous spread of i-cells. DOI: http://dx.doi.org/10.7554/eLife.05506.022

References

    1. Adler CE, Seidel CW, Mckinney SA, Sánchez Alvarado A. Selective amputation of the pharynx identifies a FoxA-dependent regeneration program in planaria. eLife. 2014;3:e02238. doi: 10.7554/eLife.02238. - DOI - PMC - PubMed
    1. Alie A, Leclère L, Jager M, Dayraud C, Chang P, Le Guyader H, Quéinnec E, Manuel M. Somatic stem cells express Piwi and Vasa genes in an adult ctenophore: ancient association of ‘germline genes’ with stemness. Developmental Biology. 2011;350:183–197. doi: 10.1016/j.ydbio.2010.10.019. - DOI - PubMed
    1. Baguñà J. The planarian neoblast: the rambling history of its origin and some current black boxes. The International Journal of Developmental Biology. 2012;56:19–37. doi: 10.1387/ijdb.113463jb. - DOI - PubMed
    1. Bely AE. Early events in annelid regeneration: a cellular perspective. Integrative and Comparative Biology. 2014;54:688–699. doi: 10.1093/icb/icu109. - DOI - PubMed
    1. Bode HR. The interstitial cell lineage of hydra: a stem cell system that arose early in evolution. Journal of Cell Science. 1996;109:1155–1164. - PubMed

Publication types

MeSH terms