. 2015 Apr 12;16(1):291.
doi: 10.1186/s12864-015-1501-9.

Incomplete meiotic sex chromosome inactivation in the domestic dog

Affiliations

Incomplete meiotic sex chromosome inactivation in the domestic dog

Federica Federici et al. BMC Genomics. .

Abstract

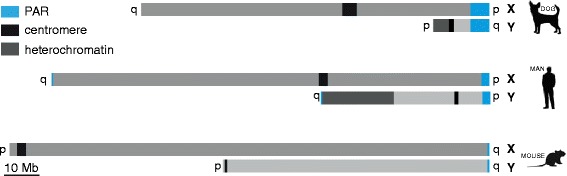
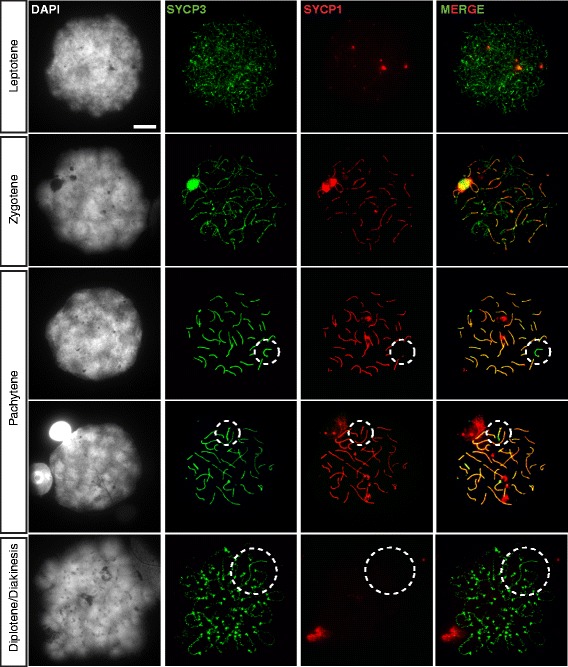
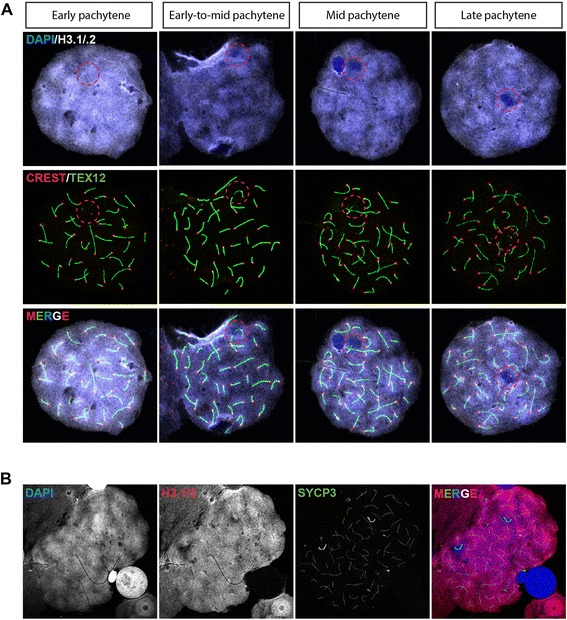
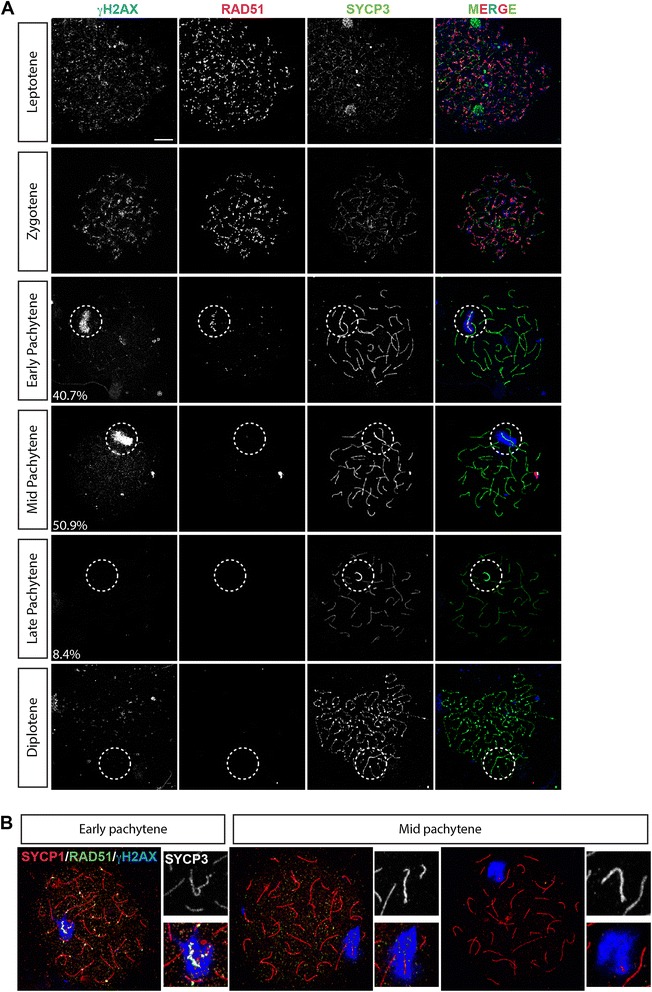
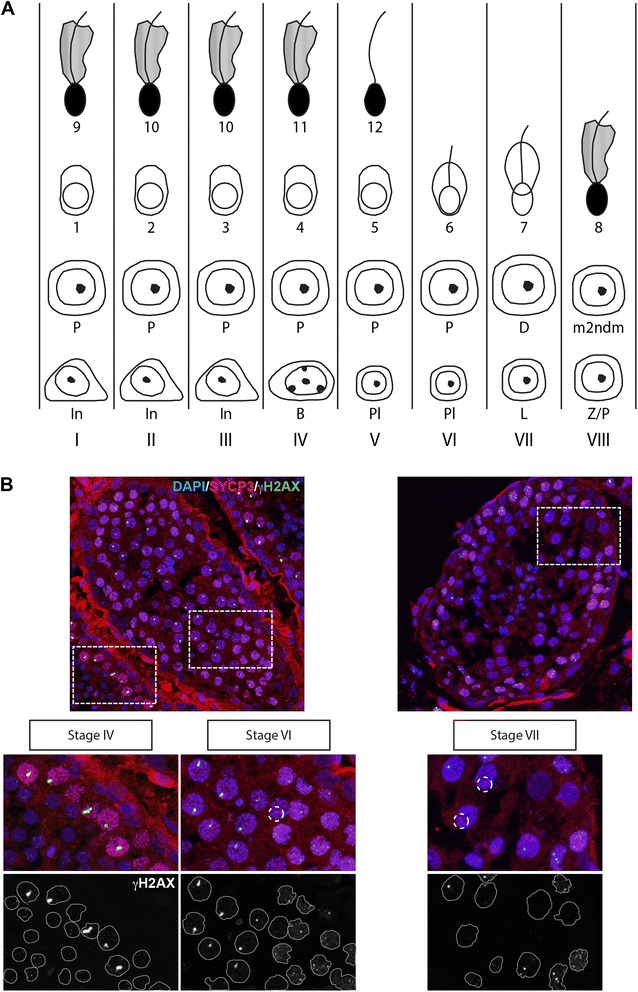
Background: In mammalian meiotic prophase, homologous chromosome recognition is aided by formation and repair of programmed DNA double-strand breaks (DSBs). Subsequently, stable associations form through homologous chromosome synapsis. In male mouse meiosis, the largely heterologous X and Y chromosomes synapse only in their short pseudoautosomal regions (PARs), and DSBs persist along the unsynapsed non-homologous arms of these sex chromosomes. Asynapsis of these arms and the persistent DSBs then trigger transcriptional silencing through meiotic sex chromosome inactivation (MSCI), resulting in formation of the XY body. This inactive state is partially maintained in post-meiotic haploid spermatids (postmeiotic sex chromatin repression, PSCR). For the human, establishment of MSCI and PSCR have also been reported, but X-linked gene silencing appears to be more variable compared to mouse. To gain more insight into the regulation and significance of MSCI and PSCR among different eutherian species, we have performed a global analysis of XY pairing dynamics, DSB repair, MSCI and PSCR in the domestic dog (Canis lupus familiaris), for which the complete genome sequence has recently become available, allowing a thorough comparative analyses.

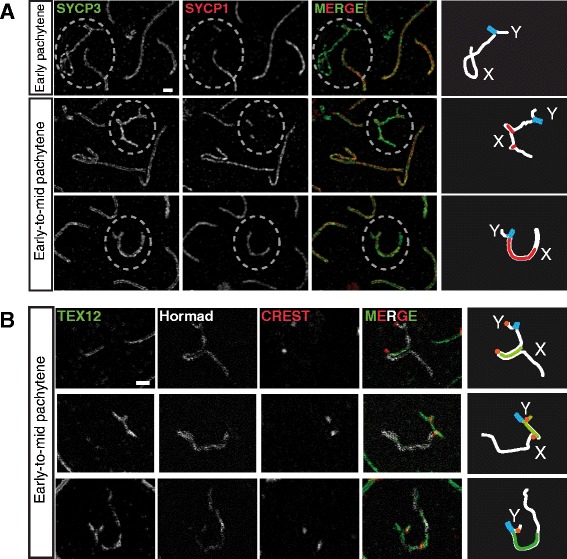
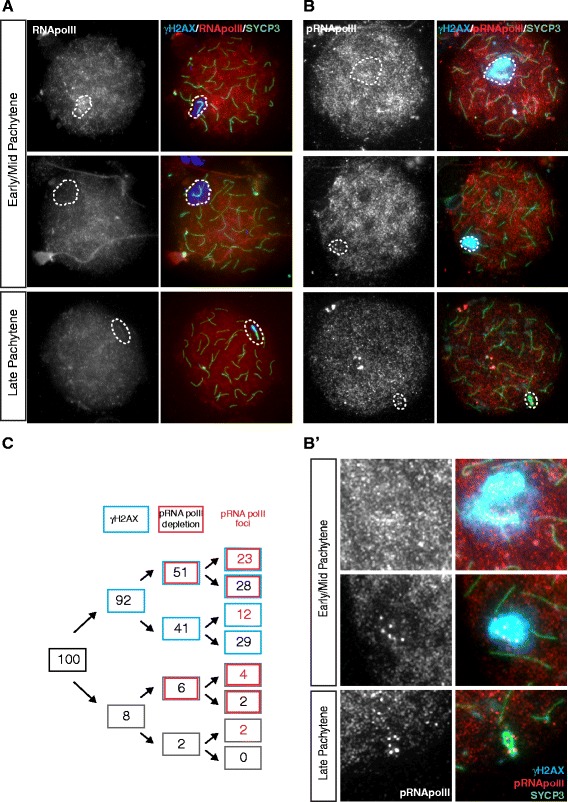
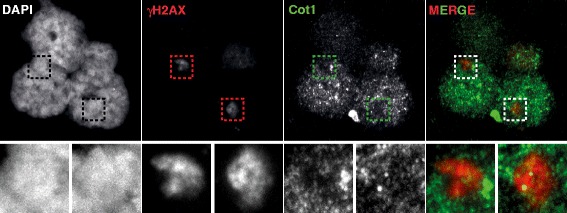
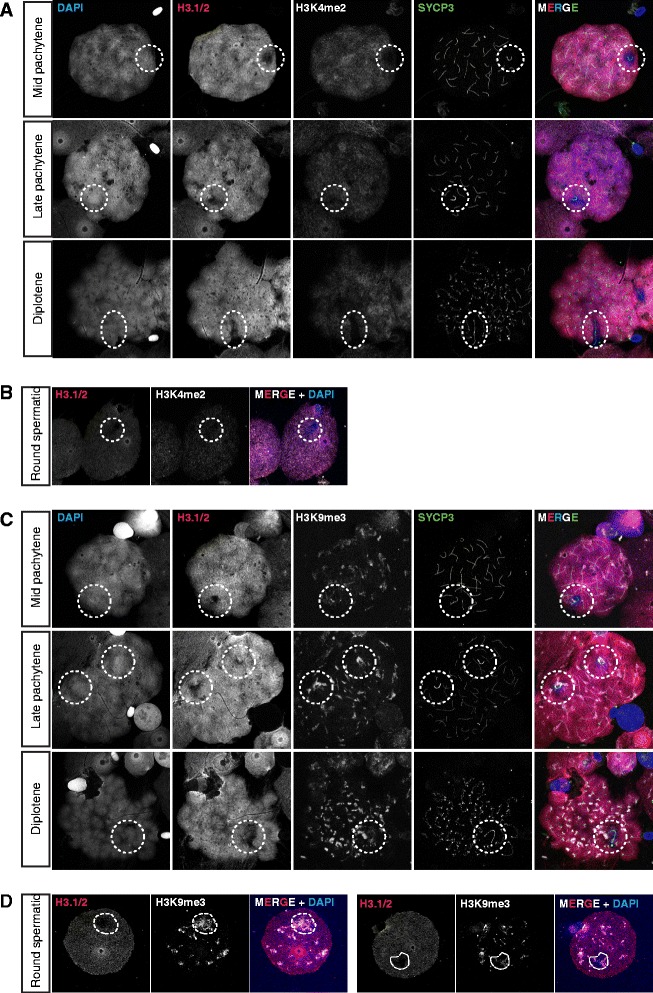
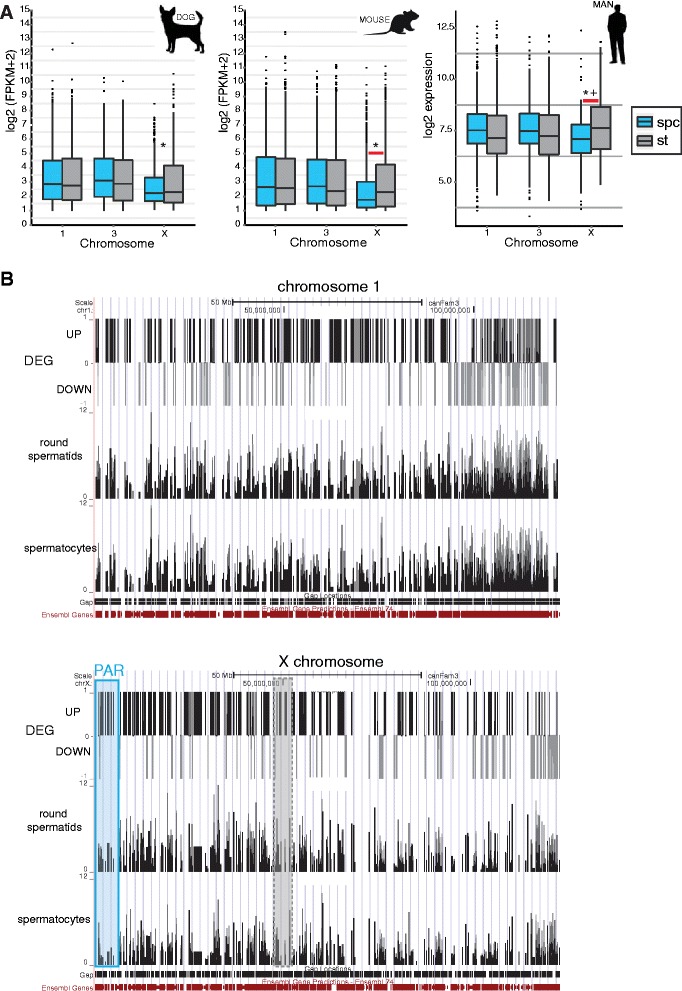
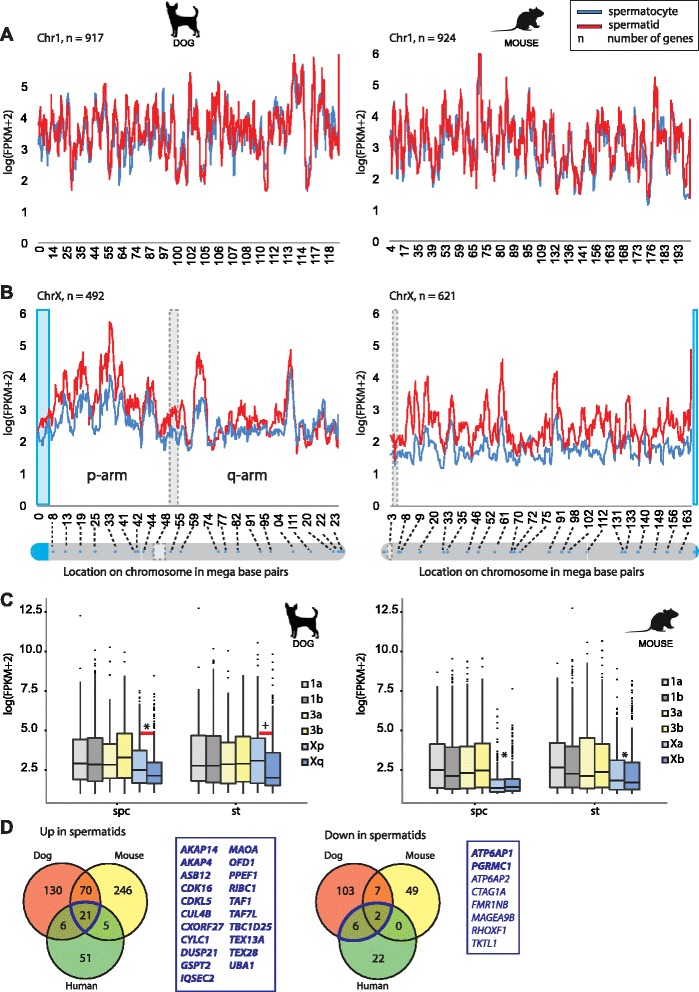
Results: In addition to PAR synapsis between X and Y, we observed extensive self-synapsis of part of the dog X chromosome, and rapid loss of known markers of DSB repair from that part of the X. Sequencing of RNA from purified spermatocytes and spermatids revealed establishment of MSCI. However, the self-synapsing region of the X displayed higher X-linked gene expression compared to the unsynapsed area in spermatocytes, and was post-meiotically reactivated in spermatids. In contrast, genes in the PAR, which are expected to escape MSCI, were expressed at very low levels in both spermatocytes and spermatids. Our comparative analysis was then used to identify two X-linked genes that may escape MSCI in spermatocytes, and 21 that are specifically re-activated in spermatids of human, mouse and dog.

Conclusions: Our data indicate that MSCI is incomplete in the dog. This may be partially explained by extensive, but transient, self-synapsis of the X chromosome, in association with rapid completion of meiotic DSB repair. In addition, our comparative analysis identifies novel candidate male fertility genes.


Figures

Figure 1
Figure 1
Dog, human, and mouse sex chromosomes. Schematic drawing of the dog, human, and mouse sex chromosomes. The PAR regions are shown in blue. The location of centromeres is indicated by a black box, and the heterochromatic areas on the Y chromosomes are shown in dark gray. p and q arms are indicated.
Figure 2
Figure 2
Extensive X chromosome self-synapsis in dog pachytene spermatocytes. Overview of the dog male meiotic prophase and the progression of synapsis between the XY pair. The left panel shows DAPI staining of the different spermatocyte nuclei, the substages are indicated on the left. To the right of the DAPI images, images of the corresponding nuclei stained for the synaptonemal complex proteins SYCP1 (green) and SYCP3 (red) are shown, followed by the merge. The XY pair in pachytene and diplotene nuclei is encircled. Bar represents 10 μm.
Figure 3
Figure 3
Progressive remodeling of the XY body during meiotic prophase in dog spermatocytes. A) Pachytene spermatocyte spread nuclei stained for DAPI (blue), H3.1/2 (white, artificial color chosen to represent the infrared signal), CREST (red) and TEX12 (green). The different substages are indicated on top. B) Pachytene spermatocyte spread nucleus stained for DAPI (blue), H3.1/2 (red), SYCP3 (green). Single immunostainings are shown in grayscale.
Figure 4
Figure 4
Transient X self-synapsis during pachytene in dog spermatocytes. A) Subregions of spermatocyte spread nuclei containing the X and Y at different substages of pachytene indicated on the left are shown at high resolution (Structured Illumination Microscopy (SIM)) to resolve the lateral elements of the synaptonemal complex immunostained for SYCP3 (white/green). The nuclei are costained for SYCP1 to identify regions of synapsis. To the right, drawings showing in white the X-specific and the Y-specific regions, in light blue PAR homologous synapsis and in red X chromosome heterologous self-synapsis. Bar represents 1 μm. B) As in A, but these nuclei were stained with antibodies against TEX12 (marker of synapsis), HORMAD1/2 (specifically localizes on unsynapsed axes) and CREST (to mark the centromeres) as indicated. To the right, drawings showing in white the X-specific and the Y-specific region , in light blue PAR homologous synapsis, in green X chromosome heterologous self-synapsis, and in orange the centromere locations. Scale bar represents 1 μm.
Figure 5
Figure 5
DSBs repair dynamics. A) Spermatocyte spread nuclei stained for γH2AX (blue), RAD51 (red) and SYCP3 (green). Single stainings are shown in gray scale. Percentages indicate the fraction of pachytene nuclei observed as shown. Zygotene nuclei were identified based on the fact that axes were split for more than one chromosome pair, and γH2AX and RAD51 staining signals were extensive. Pachytene nuclei were identified based on complete synapsis of the autosomes, and we discriminated between early-pachytene (γH2AX staining of the XY body, and still some RAD51 foci on autosomes), mid-pachytene (γH2AX staining of XY body but no RAD51 foci on autosomes), and late-pachytene (no γH2AX staining on the XY body, and thickened SYCP3 axes of the XY body) spermatocytes. Diplotene nuclei were characterized by desynapsis and thickening of the SYCP3 ends. Scale bar represents 10 μm. B) Spermatocyte spread nuclei stained for γH2AX (blue), RAD51 (green), SYCP1 (green), and SYCP3 (only shown in the enlargement, in grayscale). Close-ups show a magnification of the XY body, the top image shows SYCP3 staining (grayscale) in the area, for which the merge of SYCP1, RAD51 and γH2AX is shown below.
Figure 6
Figure 6
Loss of γH2AX from the XY body in pachytene spermatocytes becomes evident at Stage VI of the spermatogenic cycle in the dog. A) Schematic drawing of the different stages of the spermatogenic cycle of the dog (adapted from [71]). B) Immunostaining of cryosections of dog testes for γH2AX (green) and SYCP3 (red), and also stained with DAPI (blue). Stages were identified based on Russell et al. (1990) [71]. Loss of γH2AX and the thickened SYCP3 axes representative of late pachytene becomes evident at Stage VI. Single immunostainings are shown in grayscale. Magnifications are shown in the bottom panels, and some cells and the XY body are outlined for reference.
Figure 7
Figure 7
Different patterns of RNA polymerase II localization on the XY body of dog pachytene spermatocytes. A) Pachytene spermatocyte spread nuclei stained for γH2AX (blue), RNA polymerase II (RNApolII, red), and SYCP3 (green), single RNA polymerase II immunostainings are shown in gray scale. The lower panel represents a late pachytene spermatocyte in which γH2AX is already lost from part of the X chromosome and RNApolII is not clearly depleted from the XY body. B) Pachytene spermatocyte spread nuclei stained for γH2AX (blue), phosphorylated RNA polymerase II (RNApolII, red), and SYCP3 (green), single RNA polymerase II immunostainings are shown in gray scale. The lower panel represents a late pachytene spermatocyte in which γH2AX is already lost from part of the X chromosome. RNA polymerase II depletion from the XY body is evident in the nucleus shown in the middle. In addition, foci of phosphorylated RNA polymerase II staining are specifically observed in the XY body of the middle and the bottom nucleus. B’ shows magnifications of the XY body regions shown in B. C) Quantification of the percentages of pachytene nuclei (n = 101) with RNA polymerase II foci in the XY body, relative to the overall depletion of this mark from the (rest of ) the XY body, and to the enrichment of γH2AX in the XY body. Nuclei were immunostained as shown in panel B.
Figure 8
Figure 8
Reduced transcriptional activity in the XY body of dog pachytene spermatocytes. Images of Cot1 RNA FISH combined with an immunostaining for γH2AX on spermatocyte nuclei. High γH2AX signals (covering the XY body) correspond to low Cot1 signals, indicating little transcriptional activity. Magnifications of the left and right XY body are shown below each image.
Figure 9
Figure 9
Dynamics of H3K4me2 and H3K9me3 on the XY body in dog spermatocytes. A) Pachytene spermatocyte spread nuclei stained for DAPI (blue), H3.1/2 (red), H3K4me2 (white, artificial color chosen to represent the infrared signal) and SYCP3 (green). Single immunostainings are shown in grayscale. Subsequent substages indicated on the left are shown from top to bottom in the different panels. B) Spermatid spread nuclei stained for DAPI (blue), H3.1/2 (red), and H3K4me2 (white, artificial color chosen to represent the infrared signal). Single immunostainings are shown in grayscale. C) Pachytene spermatocyte spread nuclei stained for DAPI (blue), H3.1/2 (red), H3K9me3 (white, artificial color chosen to represent the infrared signal) and SYCP3 (green). Single immunostainings are shown in grayscale. Subsequent substages indicated on the left are shown from top to bottom in the different panels. D) Representative spermatid spread nuclei stained for DAPI (blue), H3.1/2 (red), and H3K9me3 (white, artificial color chosen to represent the infrared signal). Single immunostainings are shown in grayscale.
Figure 10
Figure 10
Gene expression in mouse, dog, and human spermatocytes and round spermatids. A) Left and middle: boxplots showing median, 25, and 75 percentile log2(FPKM + 2) values of the mRNA levels of genes on chromosomes 1,3, and X in dog and mouse (using the dataset published by [46]) spermatocytes (spc) and round spermatids (st). Genes that were expressed below the 25 percentile values of the whole genome average in both spermatocytes and spermatids were excluded from this analysis. Right: boxplot showing median, 25, and 75 percentile values of the mRNA levels represented as log2(expression value). The values were obtained from published microarray hybridization data using mRNA isolated from human spermatocytes and spermatids [43], and shown here for chromosomes 1,3, and X. Genes with very low expression (value <100, Affimetrix probesets with mean signal intensities <100) in both spermatocytes and spermatids were excluded from this analysis. Asterisks indicate significant difference in gene expression between autosomes and the X chromosome for spermatocytes and spermatids. Plus indicates significantly higher X-linked than autosomal gene expression in spermatids. Horizontal red lines indicate significant difference in X-linked gene expression between spermatocytes and spermatids. B) Differentially expressed genes along chromosome 1 and chromosome X, comparing expression in spermatocytes and round spermatids from the dog. Genes that are significantly up-regulated in round spermatids compared to spermatocytes (differentially expressed genes; DEG) are indicated as +1 bars, and significantly down-regulated genes are represented as −1 bars along chromosome X and chromosome 1. In addition, the log2(FPKM + 2) values of all genes along the chromosomes in spermatocytes and round spermatids are shown. Gene density along the chromosomes can be inferred from the density of the bar representing locations of Ensembl annotated genes along the chromosome shown at the bottom. For the X chromosome, the approximate location of the PAR border is indicated by a light blue line, and centromere location is indicated by a dashed gray line.
Figure 11
Figure 11
Partial conservation of MSCI and PSCR among mouse, dog, and man. A) Walking average of gene expression along chromosome 1 in spermatocytes and round spermatids from dog and mouse. B) Walking average of gene expression along chromosome X in spermatocytes and round spermatids from dog and mouse. PARs are indicated in blue. Centromere positions are shown in dashed gray boxes. C) Boxplot showing median, 25, and 75 percentile of gene expression in the p arm (Xp) and q arm (Xq) of the dog X in spermatocytes and round spermatids compared to boxplots of arbitrarily split autosomes of dog and mouse X chromosomes and autosomes. Asterisks indicate significant difference in gene expression between split autosomes and the X chromosome arms. Plus indicates significant difference between split autosomes and the q arm of the X only. Horizontal red lines indicate significant difference in X-linked gene expression between chromosome arms. D) Venn diagram showing the number of commonly up-regulated (left) and down-regulated (right) X-linked genes in round spermatids compared to spermatocytes in dog, mouse and human. Genes commonly up-regulated or down-regulated in all three species are listed in bold. Down-regulated genes common only to dog and human, not to mouse, are listed with regular characters. Borders of the areas including listed genes are marked in blue.

Similar articles

Cited by

References

    1. Perry J, Palmer S, Gabriel A, Ashworth A. A short pseudoautosomal region in laboratory mice. Genome Res. 2001;11:1826–32. - PMC - PubMed
    1. Ross MT, Grafham DV, Coffey AJ, Scherer S, McLay K, Muzny D, et al. The DNA sequence of the human X chromosome. Nature. 2005;434:325–37. doi: 10.1038/nature03440. - DOI - PMC - PubMed
    1. Young AC, Kirkness EF, Breen M. Tackling the characterization of canine chromosomal breakpoints with an integrated in-situ/in-silico approach: the canine PAR and PAB. Chromosome Res. 2008;16:1193–202. doi: 10.1007/s10577-008-1268-9. - DOI - PubMed
    1. Li G, Davis BW, Raudsepp T, Pearks Wilkerson AJ, Mason VC, Ferguson-Smith M, et al. Comparative analysis of mammalian Y chromosomes illuminates ancestral structure and lineage-specific evolution. Genome Res. 2013;23:1486–95. doi: 10.1101/gr.154286.112. - DOI - PMC - PubMed
    1. Henke A, Fischer C, Rappold GA. Genetic map of the human pseudoautosomal region reveals a high rate of recombination in female meiosis at the Xp telomere. Genomics. 1993;18:478–85. doi: 10.1016/S0888-7543(11)80003-0. - DOI - PubMed

Publication types

LinkOut - more resources