. 2015 Apr 15;16(4):8490-504.
doi: 10.3390/ijms16048490.

1H NMR-based metabolic profiling reveals the effects of fluoxetine on lipid and amino acid metabolism in astrocytes

Affiliations

1H NMR-based metabolic profiling reveals the effects of fluoxetine on lipid and amino acid metabolism in astrocytes

Shunjie Bai et al. Int J Mol Sci. .

Abstract

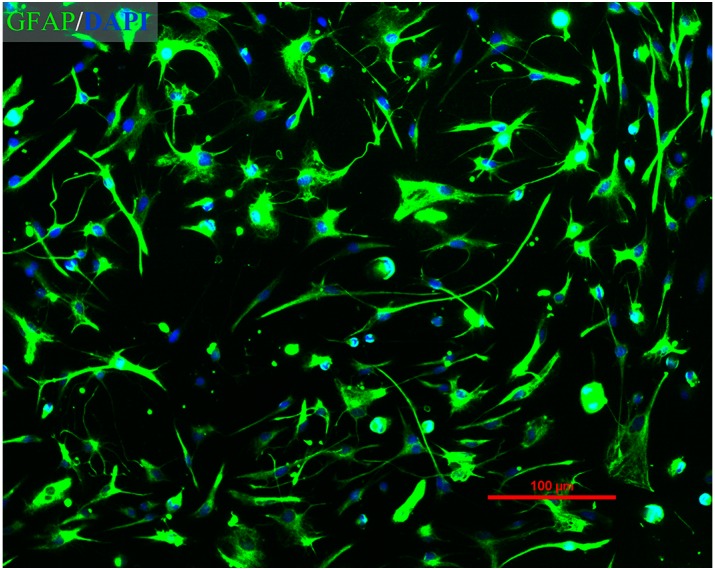
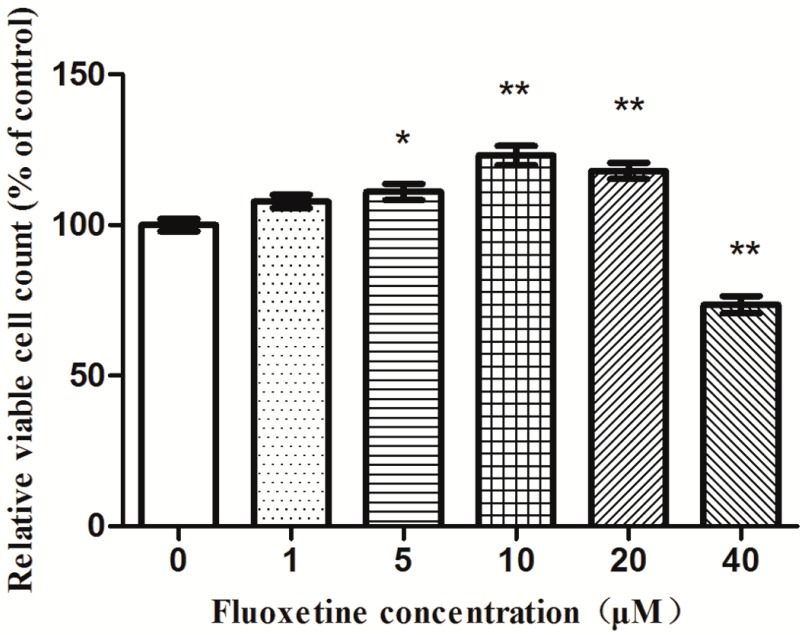
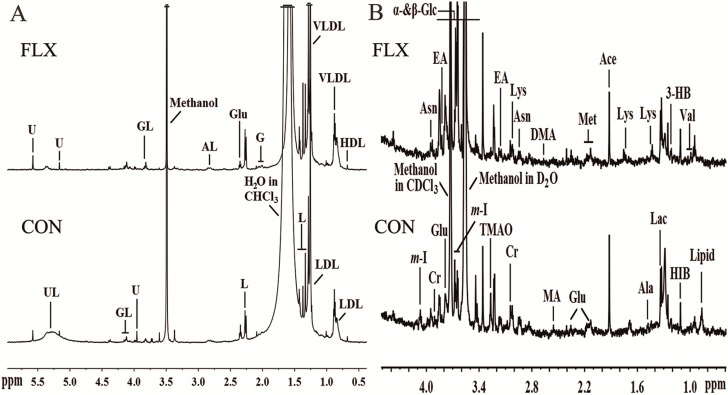
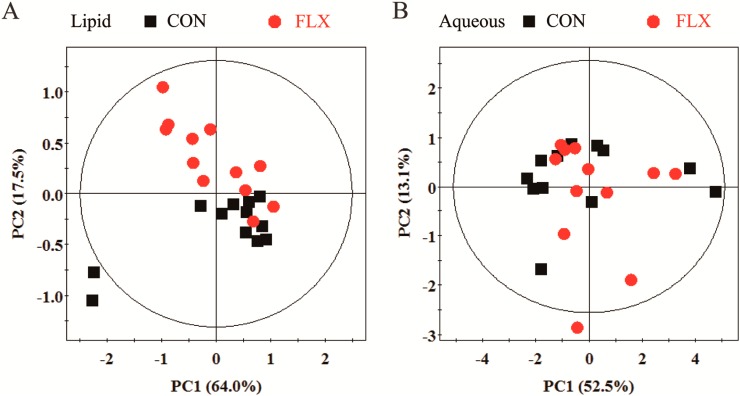
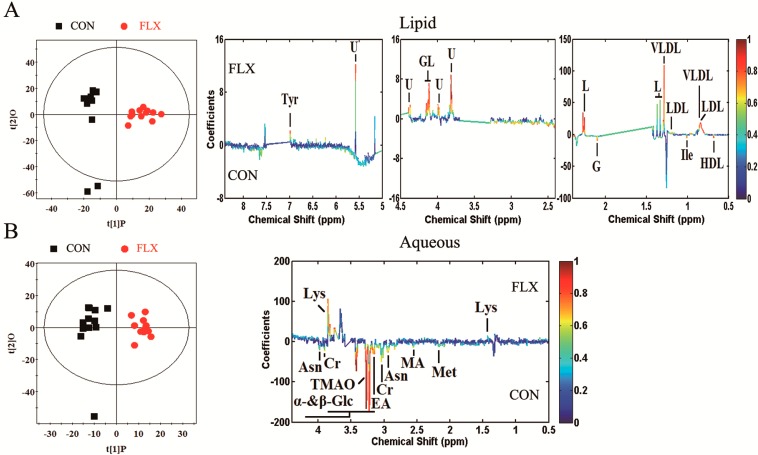
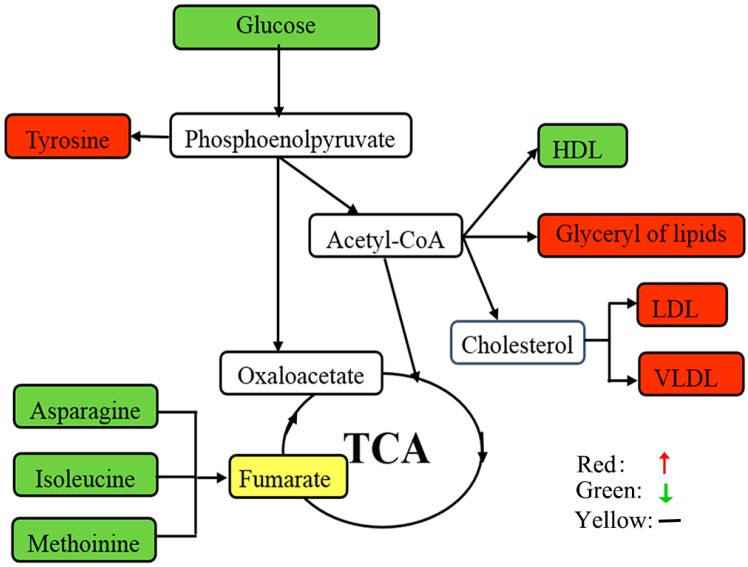
Fluoxetine, a selective serotonin reuptake inhibitor (SSRI), is a prescribed and effective antidepressant and generally used for the treatment of depression. Previous studies have revealed that the antidepressant mechanism of fluoxetine was related to astrocytes. However, the therapeutic mechanism underlying its mode of action in astrocytes remains largely unclear. In this study, primary astrocytes were exposed to 10 µM fluoxetine; 24 h post-treatment, a high-resolution proton nuclear magnetic resonance (1H NMR)-based metabolomic approach coupled with multivariate statistical analysis was used to characterize the metabolic variations of intracellular metabolites. The orthogonal partial least-squares discriminant analysis (OPLS-DA) score plots of the spectra demonstrated that the fluoxetine-treated astrocytes were significantly distinguished from the untreated controls. In total, 17 differential metabolites were identified to discriminate the two groups. These key metabolites were mainly involved in lipids, lipid metabolism-related molecules and amino acids. This is the first study to indicate that fluoxetine may exert antidepressant action by regulating the astrocyte's lipid and amino acid metabolism. These findings should aid our understanding of the biological mechanisms underlying fluoxetine therapy.


Figures

Figure 1
Figure 1
Immunofluorescence assay of purified primary rat astrocytes. Merged image of GFAP staining (green) and DAPI staining (blue) (magnification: 100×).
Figure 2
Figure 2
Effects of fluoxetine on astrocytes proliferation. A dose of 10 µM fluoxetine significantly increased astrocyte proliferation relative to untreated controls. Data reported as the means ± SEMs of five independent experiments (n = 7). * p < 0.05; ** p < 0.01, compared with the drug-free controls.
Figure 3
Figure 3
Representative 600-MHz 1H NMR spectra of lipid (A) and aqueous (B) phases of cellular extracts obtained from the control group (CON) and fluoxetine-treated group (FLX). Abbreviations: 3-HB, 3-hydroxybutyrate; Ace, acetate; AL, albumin lysyl; Ala, alanine; Asn, asparagine; Cr, creatine; DMA, dimethylamine; EA, ethanolamine; Fum, fumarate; G, glycoprotein; GL, glyceryl of lipids; Glu, glutamate; HIB, 2-hydrxoyisobutyrate; Ile, isoleucine; L, lipid; Lac, lactate; Leu, leucine; Lys, lysine; MA, methylamine; Met, methionine; m-I, myo-inositol; Suc, succinate; TMAO, trimethylamine N-oxide; Tyr, tyrosine; UL, unsaturated lipid; U, unknown; Val, valine; α-Glc, α-glucose; β-Glc, β-glucose.
Figure 4
Figure 4
PCA score plot based on 1H NMR spectra for the lipid (A) and aqueous (B) phases of cellular extracts obtained from CON (black box ■) and FLX (red dot ).
Figure 5
Figure 5
Orthogonal partial least-squares discriminant analysis (OPLS-DA) score plots and corresponding coefficient loading plots. OPLS-DA score plots (left panel) and corresponding coefficient loading plots (right panel) derived from the 1H NMR spectra of the lipid phase (A) and aqueous phase (B) of cellular extracts obtained from CON and FLX. The color map shows the significance of metabolic variations between the two groups. Positive peaks indicate metabolites that are more abundant in the fluoxetine-treated group, while negative peaks indicate metabolites that are more abundant in the untreated control group.
Figure 6
Figure 6
Schematic overview of the metabolite changes in fluoxetine-treated astrocytes. The metabolites are shown in color: red represents increased metabolites; green represents decreased metabolites; yellow represents no change; and the open box represents no detected metabolites. TCA, tricarboxylic acid.

References

    1. Kessler R.C., Berglund P., Demler O., Jin R., Koretz D., Merikangas K.R., Rush A.J., Walters E.E., Wang P.S. The epidemiology of major depressive disorder: Results from the National Comorbidity Survey Replication (NCS-R) JAMA. 2003;289:3095–3105. - PubMed
    1. Zheng P., Gao H.-C., Qi Z.-G., Jia J.-M., Li F.F., Chen J.J., Wang Y., Guo J., Melgiri N.D., Xie P. Peripheral metabolic abnormalities of lipids and amino acids implicated in increased risk of suicidal behavior in major depressive disorder. Metabolomics. 2012;9:688–696. doi: 10.1007/s11306-012-0474-9. - DOI
    1. Allaman I., Fiumelli H., Magistretti P.J., Martin J.L. Fluoxetine regulates the expression of neurotrophic/growth factors and glucose metabolism in astrocytes. Psychopharmacology. 2011;216:75–84. doi: 10.1007/s00213-011-2190-y. - DOI - PubMed
    1. Severus E., Schaaff N., Moller H.J. State of the art: Treatment of bipolar disorders. CNS Neurosci. Ther. 2012;18:214–218. doi: 10.1111/j.1755-5949.2011.00258.x. - DOI - PMC - PubMed
    1. Wong D.T., Perry K.W., Bymaster F.P. Case history: The discovery of fluoxetine hydrochloride (Prozac) Nat. Rev. Drug Discov. 2005;4:764–774. - PubMed

Publication types

LinkOut - more resources