. 2015 Apr 17;11(4):e1004827.
doi: 10.1371/journal.ppat.1004827. eCollection 2015 Apr.

Neutrophil recruitment to lymph nodes limits local humoral response to Staphylococcus aureus

Affiliations

Neutrophil recruitment to lymph nodes limits local humoral response to Staphylococcus aureus

Olena Kamenyeva et al. PLoS Pathog. .

Abstract

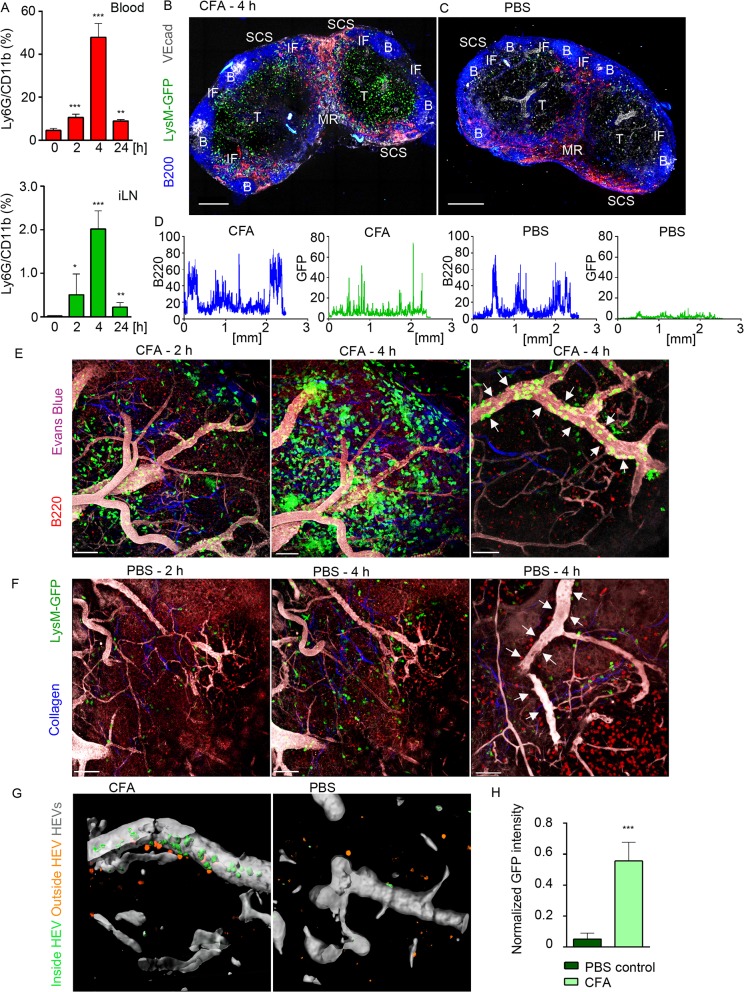
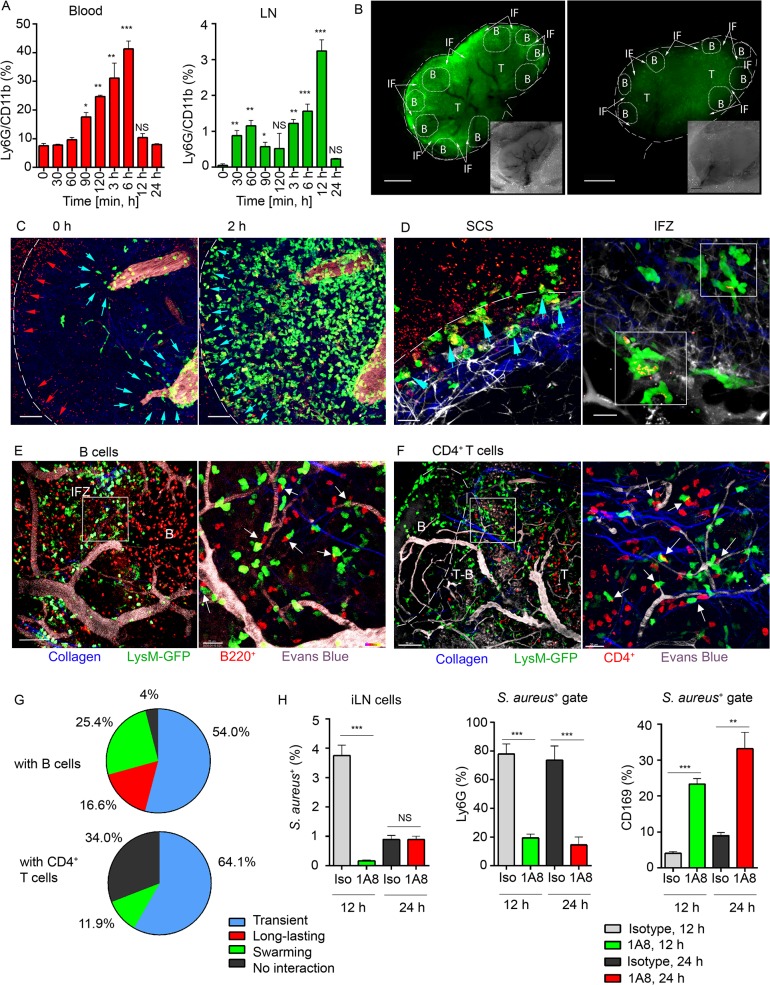
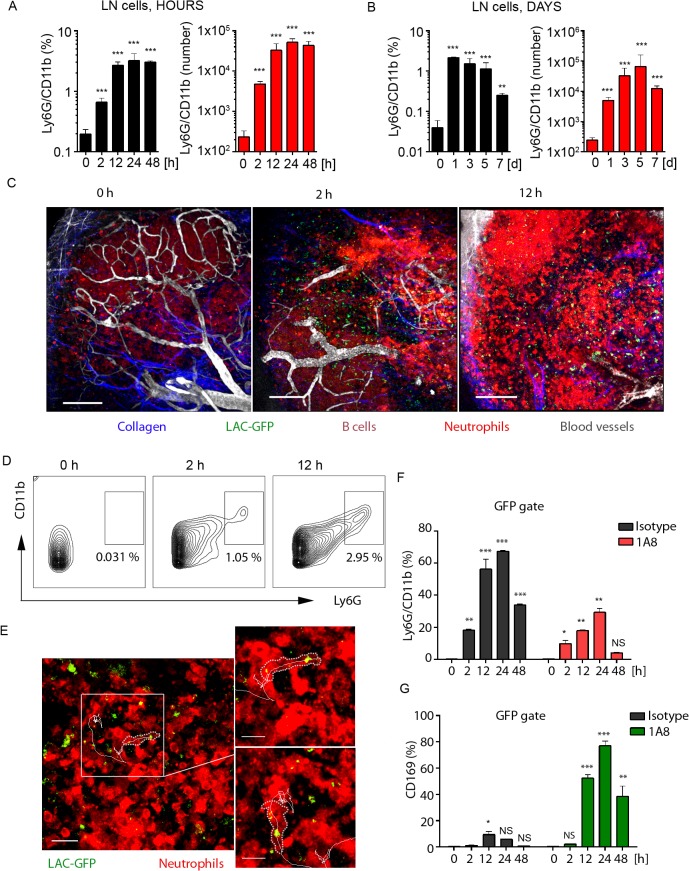
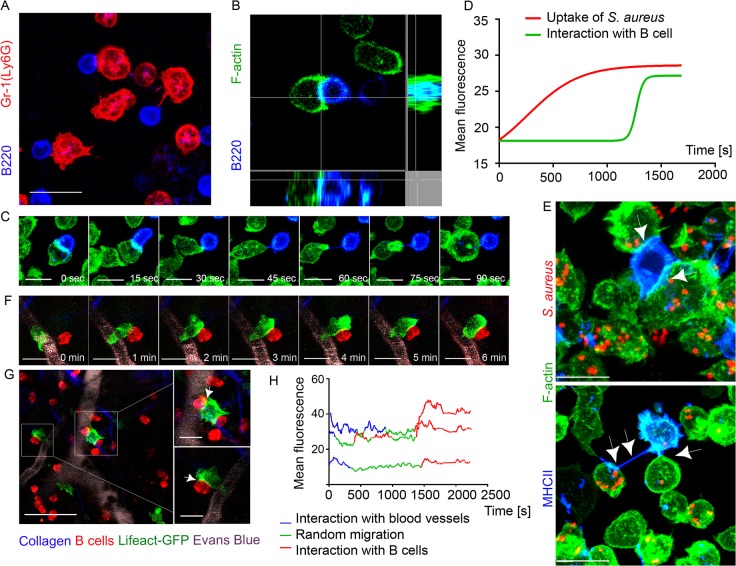
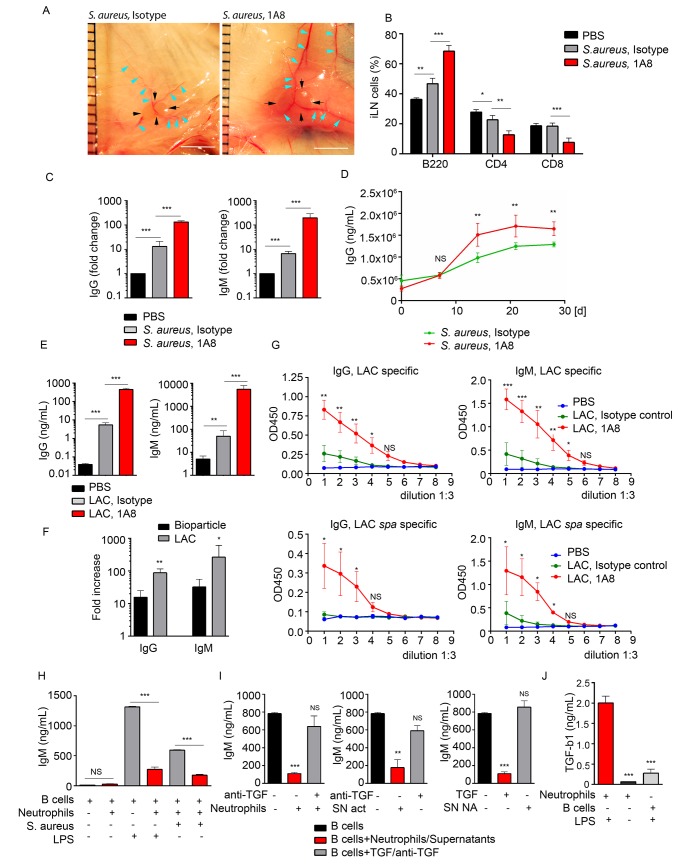
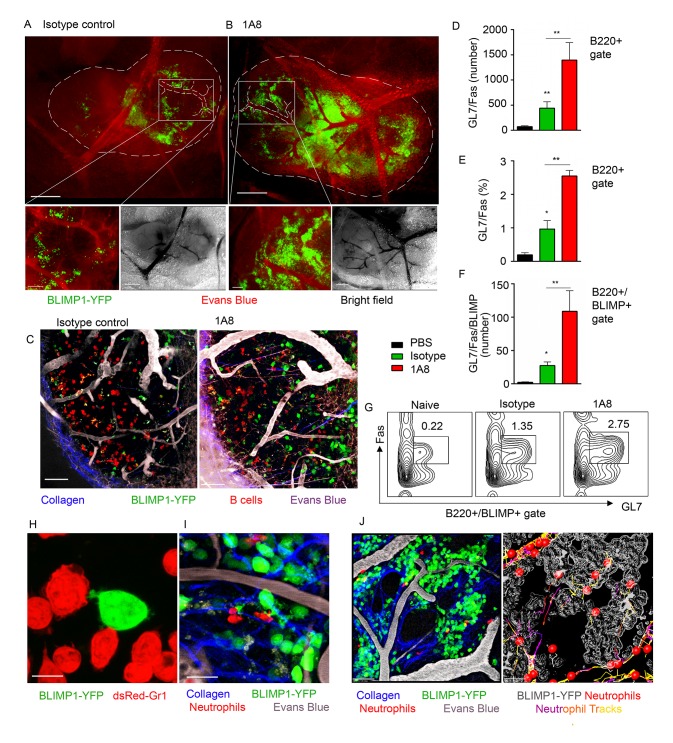
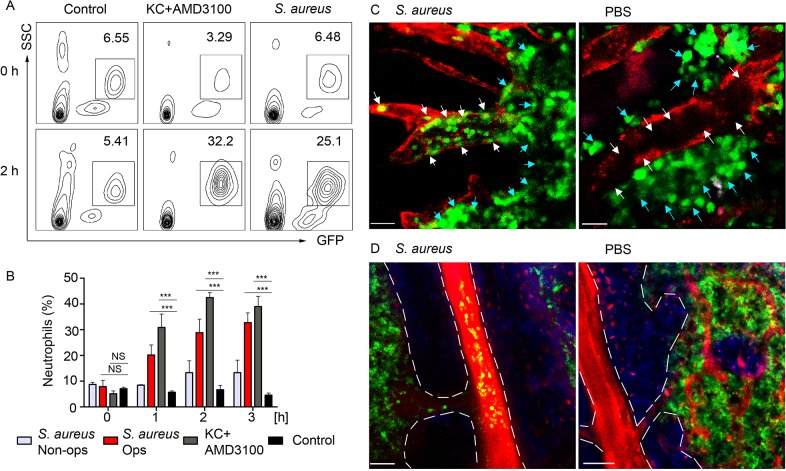
Neutrophils form the first line of host defense against bacterial pathogens. They are rapidly mobilized to sites of infection where they help marshal host defenses and remove bacteria by phagocytosis. While splenic neutrophils promote marginal zone B cell antibody production in response to administered T cell independent antigens, whether neutrophils shape humoral immunity in other lymphoid organs is controversial. Here we investigate the neutrophil influx following the local injection of Staphylococcus aureus adjacent to the inguinal lymph node and determine neutrophil impact on the lymph node humoral response. Using intravital microscopy we show that local immunization or infection recruits neutrophils from the blood to lymph nodes in waves. The second wave occurs temporally with neutrophils mobilized from the bone marrow. Within lymph nodes neutrophils infiltrate the medulla and interfollicular areas, but avoid crossing follicle borders. In vivo neutrophils form transient and long-lived interactions with B cells and plasma cells, and their depletion augments production of antigen-specific IgG and IgM in the lymph node. In vitro activated neutrophils establish synapse- and nanotube-like interactions with B cells and reduce B cell IgM production in a TGF-β1 dependent manner. Our data reveal that neutrophils mobilized from the bone marrow in response to a local bacterial challenge dampen the early humoral response in the lymph node.


Conflict of interest statement

The authors have declared that no competing interests exist.

Figures

Fig 1
Fig 1. Neutrophils arrive from HEVs to occupy IFZ, MR and SCS in immunized iLN.
Mice were injected subcutaneously with CFA. C57BL/6 mice were subjected to flow cytometry analysis of whole blood and LN cell populations; LysM-GFP expression was imaged using confocal microscopy or TP-LSM. (A) Flow cytometry analysis of blood (upper panel) and iLN cells (lower panel) in immunized C57BL/6 mice between 0 and 24 h after injection. Percentages of Ly6Ghi/CD11bhi population in live cell gate are shown. N = 2 mice/4 iLNs, repeated 3 times. Means ± SEM (B, C) Mice were sacrificed 4 h after CFA or PBS injections. The iLNs were sectioned, immunostained and analyzed by confocal microscopy. Single Z stack images were collected and assembled to form a large tiled image of the whole iLN. TZ (T), IFZ (IF), medulla (MR), LN follicle (B), and SCS are labeled. Tiled confocal images of (B) immunized and (C) PBS injected control LysM-GFP iLNs with GFPhi neutrophils (green), B cells (B220, blue), lymphatics (LYVE-1, red) and blood vessels (VE-cadherin, gray) are shown. Scale bars: 300 μm; Z = 35 μm. (D) GFP (green) and B220 (blue) channels were split, profiles of intensities of fluorescence were plotted across the images of immunized and control iLNs and measured on a scale from 1 to 100. X axis: distance in mm. Representative for 10 random profiles plotted across each section. The images are representative of 10 mice analyzed. (E, F) For TP-LSM B cells (CMTPX, red) were adoptively transferred 24 h prior to imaging; blood vessels were visualized via intravenous injection of EB (gray); collagen fibers were seen as second harmonic generation (blue). TP-LSM images of (E) immunized (S1 Movie) and (F) PBS control iLN at 2 and 4 h after injections. Scale bars: 70 μm (left and middle panels). Single HEVs (white arrows) at 4 h after injections are shown. Scale bars: 50 μm (right panels). (G) An HEV volume was defined using Imaris, and neutrophils were distinguished as cells inside (green) or outside the blood vessel (orange) in immunized (left) and PBS control (right) iLN. (H) GFP intensity of cells inside HEVs was calculated for 5 random blood vessels in immunized versus PBS control iLN, and normalized for a blood vessel volume. 5 repeats; means ± SEM.
Fig 2
Fig 2. Local immunization with S. aureus bioparticles recruits neutrophils to the LN.
S. aureus bioparticles were opsonized and injected subcutaneously near the iLN. Neutrophil recruitment to the blood and lymphoid organs was analyzed by flow cytometry in C57BL/6 mice, or imaged using epifluorescent stereomicroscope or TP-LSM in LysM-GFP mice with adoptively transferred lymphocytes. (A) Kinetics of neutrophil recruitment to the blood (left panel) and to the iLN (right panel) between 0 and 24 h after immunization. N = 3 mice/6 iLNs; 3 independent experiments. Means ± SEM. (B) Fluorescent (main image) and bright field (lower right corner) images of immunized and PBS control LysM-GFP LNs are shown at 12 h after injection. Neutrophils: LysM-GFP, green. Image labeling: SCS (white dashed line), TZ (T), IFZ (IF, white arrows), LN follicles (B, dotted lines). Data is representative of 3 mice (6 iLNs) per group. (C) TP-LSM images of neutrophils (LysM-GFP, green) exiting blood vessels in the LN stroma (left panel, blue arrowheads) and accumulating in the SCS (right panel, blue arrowheads) between 2 h (left) and 4 h (right) after S. aureus (red arrowheads) injection are shown (S3 Movie, Mobilization). ILN border, white dashed line; HEVs, EB, gray. Scale bars: 50 μm. (D) Neutrophils phagocytizing S. aureus in the SCS (left panel, blue arrowheads) and swarming in the IFZ (right panel, white squares) between 3 and 4 h after S. aureus inoculation are shown (S3 Movie, Swarming). Scale bars: 25 μm (right), 20 μm (left). Data is representative of 12 imaging sessions. (E, F) DsRed B cells or CD4+ T cells were adoptively transferred 24 h prior to imaging. Neutrophil (green) interactions with (E) B cells (red) or (F) CD4+ T cells (red) at the T-B border (dashed line) at 12 h after S. aureus injection are shown. Blood vessels, EB (gray); collagen, second harmonic (blue). Scale bars: (C) 50 μm; (D, left) 50 μm; (D, right) 20 μm, (E, left) 50 μm; (E, right) 20 μm; (F, left) 70 μm; (F, right) 20 μm. (G) The percentages of short and long-lasting interactions formed by neutrophils with B cells (upper chart) and by neutrophils with CD4+ T cells (lower chart). Data is representative of 3 independent computations. (H) Analysis of S. aureus uptake by Ly6G+ and CD169+ populations in the iLN of isotype control or 1A8-injected mice between 0 and 48 h after immunization. N = 4 iLNs; 3 repeats. Means ± SEM.
Fig 3
Fig 3. Local LAC-GFP infection recruits neutrophils to the iLN.
C57BL/6 or dsRed BM chimeric mice were injected subcutaneously near the iLN with LAC-GFP in amount of 1 x 10⁵ CFU per iLN or given PBS as a control. Neutrophil recruitment to the iLN was analyzed by flow cytometry between 0 and 48 h. PBS injected control is shown as a time point 0 of infection. DsRed chimeric mice were imaged using TP-LSM between 2 and 12 h after infection. (A) Kinetics of neutrophil mobilization to the iLN between 0 and 48 h after infection is shown. (B) Kinetics of neutrophil mobilization to the iLN between days 0 and 7 after infection is shown. (A, B) Percentages of Ly6Ghi/CD11bhi population (left) and total Ly6Ghi/CD11bhi cell numbers per iLN (right) in live cell gate are shown. N = 4 mice/8 iLNs. Means ± SD. (C) TP-LSM images of neutrophil accumulation (dsRedhi, bright red) in iLN at 0 h (left), 2 h (middle), and 12 h (right) after LAC-GFP (green) injection are shown (S7 Movie). Blood vessels (EB, gray); collagen (second harmonic, blue). IFZ (IF), LN follicle (B, dotted line), and LN borders (dashed line) are labeled. Scale bars: 50 μm. (D) At indicated time points, representative flow cytometry plots show Ly6Ghi/CD11bhi cell population in the iLN of infected dsRed mice. Data is representative of 4 iLNs. (E) 2 min migration route of a single neutrophil (red) loaded with LAC-GFP bacteria (green) is shown. IFZ, 6 h after infection (S8 Movie). Enlarged images of the same cell at time points 1 and 100 sec are shown to the right. Neutrophil cell border is outlined with dotted line; cell track is shown with solid line. Scale bars: 20 μm (left), 5 μm (right). Data is representative of 4 imaging sessions. (F, G) Infected and control mice were injected with isotype control or 1A8 antibody at 100 μg/mouse on day -1 and 0 of infection and LN cells were analyzed for GFP signal using flow cytometry. Analysis of LAC-GFP uptake by (F) Ly6Ghi/CD11bhi and (G) CD169+ populations in the iLN of isotype control or 1A8 injected mice between 0 and 48 h after infection is shown. N = 4 mice/8 iLNs. Means ± SD.
Fig 4
Fig 4. F-actin accumulates at interaction sites between neutrophils and B cells.
Lifeact-GFP neutrophils and B cells were co-cultured on ICAM-1+VCAM-1+KC coated surface and imaged using confocal microscopy. Lifeact-GFP neutrophils and dsRed B cells were adoptively transferred into C57BL/6 mice 24 h prior to imaging. Mice were injected subcutaneously with S. aureus bioparticles near the iLNs, and imaged using TP-LSM 12 h after immunization. (A) A live-cell confocal image of BM derived neutrophils (Ly6G, red) and LN derived B cells (B220, blue) co-cultured for 2 h. Scale bar: 10 μm. (B) Single-plane confocal image of F-actin at a cell-cell contact between a neutrophil (Lifeact-GFP, green) and a B cell (B220, blue). (C) Time-lapse series of images shows F-actin clustering at the leading edge of a neutrophil interacting with a B cell. Scale bars: 7 μm. (D) Comparison of F-actin assembly during S. aureus phagocytosis by neutrophils and during neutrophil-B cell interactions measured as increase in the GFP fluorescence intensity (S9 Movie). 25 cells analyzed, curves averaged and fitted using GraphPad Prism software. (E) Live-cell confocal images of F-actin enriched tight cell-cell contacts (upper image, arrowheads) and nanotubes (lower image, arrowheads) formed between neutrophils (Lifeact-GFP, green) and B cells (MHCII, blue) co-cultured for 2 h, and with S. aureus bioparticles added to the co-cultures. Scale bars: 7 μm. (F) Time-lapse series of TP-LSM images showing steps of short-term interaction between a Lifeact-GFP neutrophil (green) and a B cell (red) in perivascular space in vivo. Scale bars: 7 μm. (G) Lifeact-GFP neutrophils (green) encountering B cells (red) near blood vessels (EB, gray); scale bar: 25 μm. Enlarged images (squares to the right); scale bars: 10 μm. (H) F-actin clustering in neutrophils during their egress from the blood vessels, random migration, and interaction with B-cells measured as GFP mean fluorescence intensity. The fluorescence fluctuation in 3 cells is shown; 25 cells analyzed.
Fig 5
Fig 5. Neutrophils limit the humoral response following local immunization or infection.
C57BL/6 mice were given PBS as a baseline control, immunized with S. aureus bioparticles, or infected with LAC-GFP. Isotype control or 1A8 antibody was injected intraperitoneally at 100 μg/mouse on day -1, 0 and 1 of immunization/infection. (A) Images of iLNs in isotype control (left) and neutrophil depleted (right) mice immunized with S. aureus bioparticles are shown at day 5 after immunization. Indicated are LN edges (black arrows), blood vessels (blue arrows). Scale bars: 5 mm. (B) Flow cytometry analysis of B and T cell populations in the iLN of isotype control or neutrophil-depleted mice 3 days after immunization. N = 4 iLNs; 3 repeats. Means ± SEM. (C) ELISA of total IgG and IgM produced by iLN B cells isolated from PBS control, immunized isotype control and immunized neutrophil-depleted (1A8) mice. B cells were isolated from the iLNs at day 6 after immunization and cultured for 3 days. N = 4 iLNs. Data are shown as fold change. 3 repeats. Means ± SEM. (D) ELISA of total IgG in the serum of immunized isotype control and immunized neutrophil-depleted mice measured at days 0, 7, 14, 21 and 28 after immunization. N = 4 mice; 2 repeats; means ± SEM. (E-G) Mice were depleted of neutrophils as above and infected with LAC-GFP. (E) ELISA of total IgG and IgM produced by iLN B cells. ILNs were harvested at day 5 after infection, B cells were isolated and cultured for 3 days. N = 5–7 iLNs. Data are shown as antibody concentration in B cell supernatants. Means ± SD. (F) Comparison of fold changes in IgG and IgM production in neutrophil-depleted and isotype iLNs, calculated for S. aureus immunized versus LAC-GFP infected mice. Data shown as fold increases (Means ± SD). (G) ELISA of LAC-specific (upper panel) and LAC spa-specific IgG and IgM. N = 5–7 iLNs. Means ± SD. (H) ELISA of IgM produced in vitro by LPS or S. aureus activated LN B cells in presence of neutrophils, activated correspondingly. No LPS in culture used as a baseline control. (I) ELISA of IgM produced by LPS activated iLN B cells in presence of LPS-activated neutrophils supernatants from LPS-activated (SN act) and non-activated neutrophils (SN NA), neutralizing anti-TGF-β1 antibody, and TGF-β1. (J) ELISA results measuring TGF-β1 produced by activated neutrophils, non-activated neutrophils or LPS-activated B cells in 24 h cultures. (H-J) Final concentration of LPS in all B cell cultures: 2 μg/mL. 3 to 5 repeats for each of in vitro experiments. Means ± SEM.
Fig 6
Fig 6. Neutrophil depletion results in increased population of BLIMP1-YFP+ and GC B cells in immunized iLN.
BLIMP1-YFP BM reconstituted mice were immunized with S. aureus subcutaneously, and injected with isotype control antibody or depleted of neutrophils using 1A8 antibody at days -1, 0 and 1 of immunization. ILNs were examined using epifluorescent microscopy, TP-LSM or flow cytometry. (A, B) Immunized mice were injected intravenously with Evans blue, and the iLNs of euthanized mice were exposed on a skin flip for imaging using stereomicroscope. Epifluorescent images of intact iLNs in immunized mice injected with (A) isotype control or (B) 1A8 antibody are shown. BLIMP1-YFP+ cells (green); blood vessels (red). Fluorescent images (top); corresponding bright field images (bottom left); scale bars, 400 μm. Lymph node borders and single blood vessels in IFZ are shown with dashed lines. Representative perivascular areas occupied with BLIMP1-YFP+ cells within the IFZ are outlined with white squares and their enlarged images are shown (bottom right); scale bars: 100 μm. (C) DsRed B cells or BM derived neutrophils were adoptively transferred at day 1–2 after immunization. TP-LSM images show LN follicles (red) from an immunized iLN of an isotype control-injected (left) or neutrophil-depleted (right) mouse. Scale bars, 20 μm. (D-F) Results from flow cytometry analysis of GC B cell (D) number and (E) percentage within the B220+ gate; and (F) BLIMP1-YFP+ GC B cell number within the B220+ gate. (G) Representative flow cytometry patterns of GC B cells from isotype control or 1A8 treated mice. (D-G) N = 4 iLNs; 3 independent experiments. Means ± SEM (H) BLIMP1-YFP B cells were isolated from the iLN and activated with LPS in vitro for 72 h. DsRed neutrophils were isolated from the BM and activated with LPS in vitro for 24 h. The cells were co-cultured for 2 h on ICAM-1/VCAM-1 coated surface. A confocal image of neutrophils (dsRed, red) interacting with a B cell (YFP, green) is shown. Scale bar: 5 μm. (I) DsRed BM derived neutrophils were adoptively transferred at day 7 after immunization, and recipient mice imaged 24 h later. A TP-LSM image of neutrophils (dsRed, red) interacting with B cells (YFP, green) is shown. Blood vessels (EB, gray). Scale bar: 10 μm. (J) Representative TP-LSM image of BLIMP1-YFP+ cells (green) localized in perivascular niches (S1 Movie) with neutrophils (red) migrating through the niches (left panel). Neutrophil tracks localized within the inside perimeter (outline, gray) of the niches (right panel). Scale bar: 20 μm. (H-J) Representative of 3 experiments.
Fig 7
Fig 7. BM neutrophils are mobilized to the blood stream after local immunization.
LysM-GFP mice were injected with S. aureus bioparticles near the iLN. Neutrophil mobilization was analyzed using flow cytometry of the whole blood or TP-LSM of the calvarium bone marrow. Anti VE-cadherin antibody or EB were injected intravenously to outline the blood vessels. (A) Flow cytometry plots of GFPhi cells in the blood of mice injected subcutaneously with PBS, intravenously with KC+AMD3100, or subcutaneously with S. aureus are shown. Results are from 0–2 h after injection and representative of 3 independent experiments. (B) Kinetics of neutrophil recruitment in mice injected with opsonized (Ops) or non-opsonized (Non-ops) S. aureus versus KC+AMD3100 between 0 and 3 h. Data are from flow cytometry analysis of whole blood. N = 3; repeated 3 times. Means ± SEM. (C) TP-LSM images of calvarium capillaries (Alexa Fluor 660-conjugated anti-VE-cadherin, red) at 2 h after immunization (left) or PBS injection (right). GFPhi cells (green) within the niche (blue arrows) and within the blood vessels (white arrows) are indicated. Scale bars: 30 μm. (D) Images of the central vein in S. aureus (left) and PBS (right) injected mice 3 h later (S1 Movie). Central vein and vascular niche (EB, red) borders are shown with dashed lines. Scale bars: 50 μm. Images are representative of 5 imaging sessions.

References

    1. Gonzalez S.F., et al., Trafficking of B cell antigen in lymph nodes. Annu Rev Immunol, 2011. 29: p. 215–33. 10.1146/annurev-immunol-031210-101255 - DOI - PubMed
    1. Buettner M. and Bode U., Lymph node dissection—understanding the immunological function of lymph nodes. Clin Exp Immunol, 2012. 169(3): p. 205–12. 10.1111/j.1365-2249.2012.04602.x - DOI - PMC - PubMed
    1. Kastenmüller W., et al., A spatially-organized multicellular innate immune response in lymph nodes limits systemic pathogen spread. Cell, 2012. 150(6): p. 1235–48. 10.1016/j.cell.2012.07.021 - DOI - PMC - PubMed
    1. Chtanova T., et al., Dynamics of neutrophil migration in lymph nodes during infection. Immunity, 2008. 29(3): p. 487–496. 10.1016/j.immuni.2008.07.012 - DOI - PMC - PubMed
    1. Maletto B.A., et al., Presence of neutrophil-bearing antigen in lymphoid organs of immune mice. Blood, 2006. 108(9): p. 3094–102. - PubMed

Publication types