

MPnRAGE: A technique to simultaneously acquire hundreds of differently contrasted MPRAGE images with applications to quantitative T1 mapping
- PMID: 25885265
- PMCID: PMC4609219
- DOI: 10.1002/mrm.25674
MPnRAGE: A technique to simultaneously acquire hundreds of differently contrasted MPRAGE images with applications to quantitative T1 mapping
Abstract
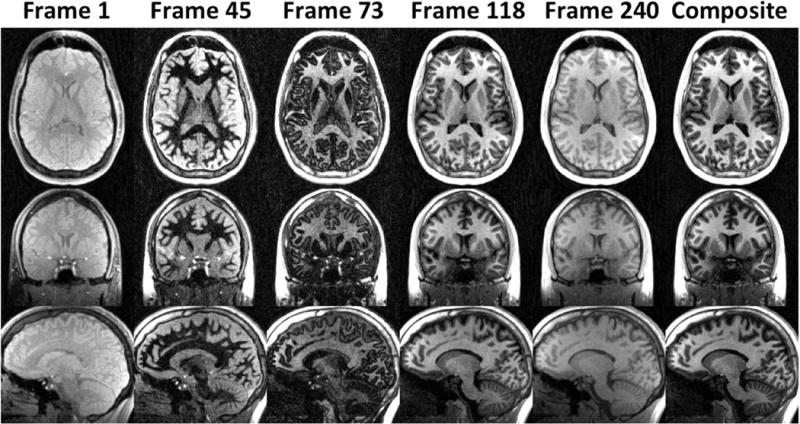
Purpose: To introduce a new technique called MPnRAGE, which produces hundreds of images with different T1 contrasts and a B1 corrected T1 map.
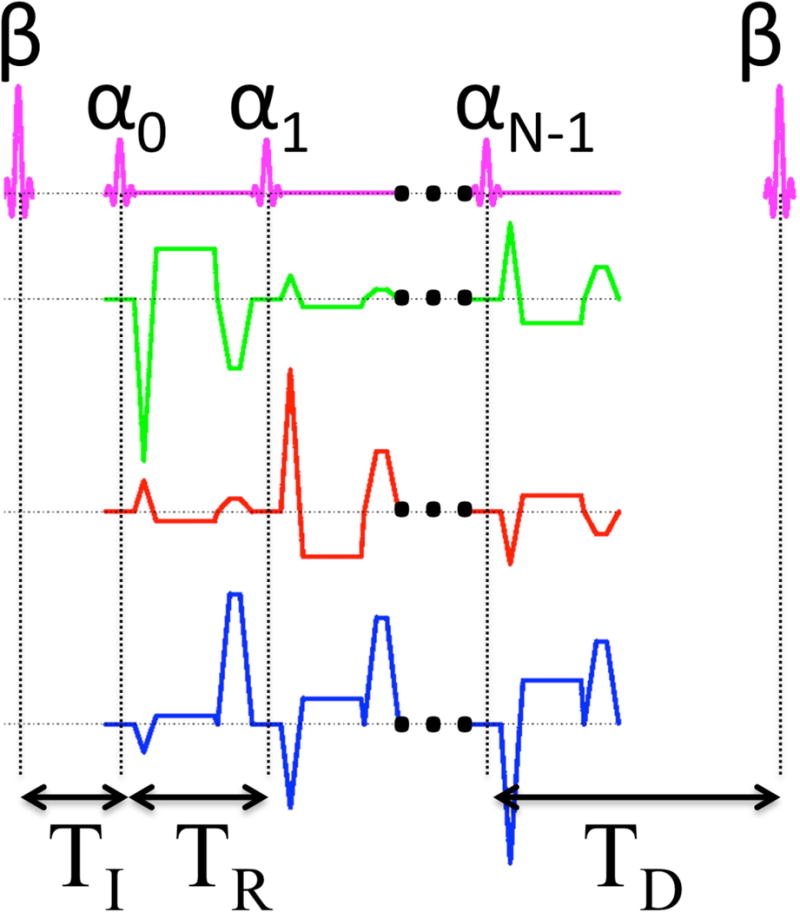
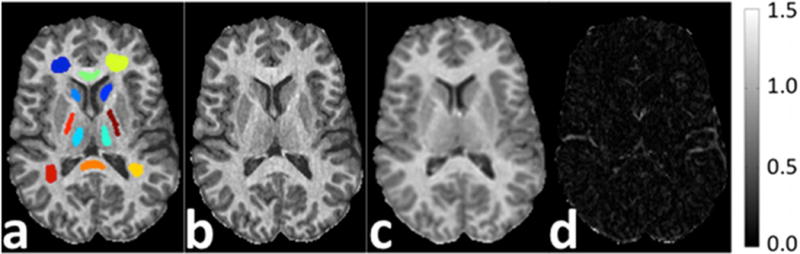
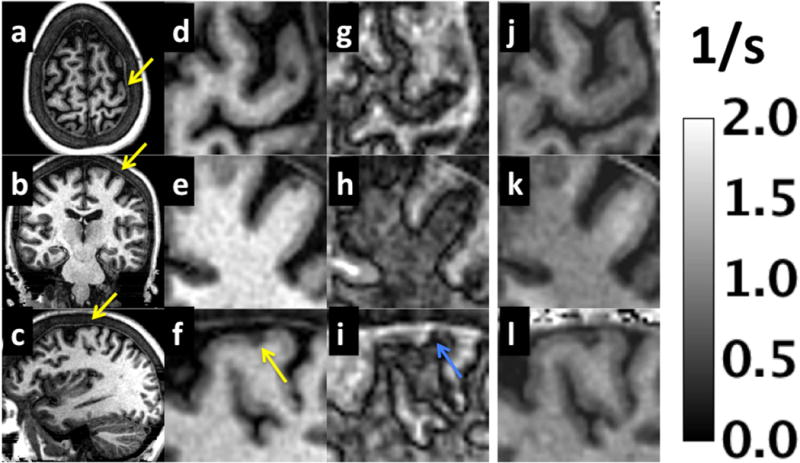
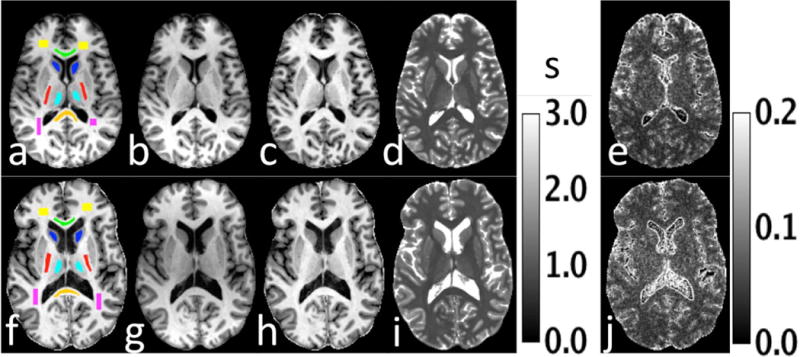
Theory and methods: An interleaved three-dimensional radial k-space trajectory with a sliding window reconstruction is used in conjunction with magnetization preparation pulses. This work modifies the SNAPSHOT-FLASH T1 fitting equations for radial imaging with view-sharing and develops a new rapid B1 correction procedure. MPnRAGE is demonstrated in phantoms and volunteers, including two volunteers with eight scans each and eight volunteers with two scans each. T1 values from MPnRAGE were compared with those from fast spin echo inversion recovery (FSE-IR) in phantoms and a healthy human brain at 3 Tesla (T).
Results: The T1 fit for human white and gray matter was T1MPnRAGE = 1.00 · T1FSE-IR + 24 ms, r(2) = 0.990. Voxel-wise coefficient of variation in T1 measurements across eight time points was between 0.02 and 0.08. Region of interest-based T1 values were reproducible to within 2% and agree well with literature values.
Conclusion: In the same amount of time as a traditional MPRAGE exam (7.5 min), MPnRAGE was shown to produce hundreds of images with alternate T1 contrasts as well as an accurate and reproducible T1 map that is robust to B1 errors.
Keywords: Look-Locker; MPRAGE; T1 mapping; T1 weighted imaging; inversion recovery; segmentation.
© 2015 Wiley Periodicals, Inc.
Figures
Similar articles
-
Fast T1 mapping of the brain at high field using Look-Locker and fast imaging.Magn Reson Imaging. 2017 Feb;36:49-55. doi: 10.1016/j.mri.2016.10.022. Epub 2016 Oct 27. Magn Reson Imaging. 2017. PMID: 27989908
-
Model-based T1 mapping with sparsity constraints using single-shot inversion-recovery radial FLASH.Magn Reson Med. 2018 Feb;79(2):730-740. doi: 10.1002/mrm.26726. Epub 2017 Jun 11. Magn Reson Med. 2018. PMID: 28603934
-
Modulated repetition time look-locker (MORTLL): a method for rapid high resolution three-dimensional T1 mapping.J Magn Reson Imaging. 2009 Sep;30(3):640-8. doi: 10.1002/jmri.21842. J Magn Reson Imaging. 2009. PMID: 19630081 Free PMC article.
-
Temporally resolved parametric assessment of Z-magnetization recovery (TOPAZ): Dynamic myocardial T1 mapping using a cine steady-state look-locker approach.Magn Reson Med. 2018 Apr;79(4):2087-2100. doi: 10.1002/mrm.26887. Epub 2017 Aug 30. Magn Reson Med. 2018. PMID: 28856778 Free PMC article.
-
Magnetic resonance imaging of the subthalamic nucleus for deep brain stimulation.J Neurosurg. 2016 Jan;124(1):96-105. doi: 10.3171/2015.1.JNS142066. Epub 2015 Aug 21. J Neurosurg. 2016. PMID: 26295914 Review.
Cited by
-
Fast quantitative MRI using controlled saturation magnetization transfer.Magn Reson Med. 2019 Feb;81(2):907-920. doi: 10.1002/mrm.27442. Epub 2018 Sep 14. Magn Reson Med. 2019. PMID: 30257044 Free PMC article.
-
Free-breathing, fat-corrected T1 mapping of the liver with stack-of-stars MRI, and joint estimation of T1, PDFF, , and .Magn Reson Med. 2024 Nov;92(5):1913-1932. doi: 10.1002/mrm.30182. Epub 2024 Jun 23. Magn Reson Med. 2024. PMID: 38923009 Free PMC article.
-
Mindfulness video game improves connectivity of the fronto-parietal attentional network in adolescents: A multi-modal imaging study.Sci Rep. 2019 Dec 10;9(1):18667. doi: 10.1038/s41598-019-53393-x. Sci Rep. 2019. PMID: 31822684 Free PMC article.
-
Robust Motion Correction Strategy for Structural MRI in Unsedated Children Demonstrated with Three-dimensional Radial MPnRAGE.Radiology. 2018 Nov;289(2):509-516. doi: 10.1148/radiol.2018180180. Epub 2018 Jul 31. Radiology. 2018. PMID: 30063192 Free PMC article.
-
Role of autonomic, nociceptive, and limbic brainstem nuclei in core autism features.Autism Res. 2024 Feb;17(2):266-279. doi: 10.1002/aur.3096. Epub 2024 Jan 26. Autism Res. 2024. PMID: 38278763 Free PMC article.
References
-
- Mugler JP, 3rd, Brookeman JR. Three-dimensional magnetization-prepared rapid gradient-echo imaging (3D MP RAGE) Magn Reson Med. 1990;15(1):152–157. - PubMed
-
- Marques JP, Kober T, Krueger G, van der Zwaag W, Van de Moortele PF, Gruetter R. MP2RAGE, a self bias-field corrected sequence for improved segmentation and T1-mapping at high field. Neuroimage. 2010;49(2):1271–1281. - PubMed
-
- Barkovich AJ, Kjos BO, Jackson DE, Jr, Norman D. Normal maturation of the neonatal and infant brain: MR imaging at 1.5 T. Radiology. 1988;166(1 Pt 1):173–180. - PubMed
Publication types
MeSH terms
Grants and funding
LinkOut - more resources
Full Text Sources
Other Literature Sources
Medical
