. 2015 Feb 12;17(1):12.
doi: 10.1186/s12968-015-0127-z.

Gradient Spin Echo (GraSE) imaging for fast myocardial T2 mapping

Affiliations

Gradient Spin Echo (GraSE) imaging for fast myocardial T2 mapping

Alois M Sprinkart et al. J Cardiovasc Magn Reson. .

Abstract

Background: Quantitative Cardiovascular Magnetic Resonance (CMR) techniques have gained high interest in CMR research. Myocardial T2 mapping is thought to be helpful in diagnosis of acute myocardial conditions associated with myocardial edema. In this study we aimed to establish a technique for myocardial T2 mapping based on gradient-spin-echo (GraSE) imaging.

Methods: The local ethics committee approved this prospective study. Written informed consent was obtained from all subjects prior to CMR. A modified GraSE sequence allowing for myocardial T2 mapping in a single breath-hold per slice using ECG-triggered acquisition of a black blood multi-echo series was developed at 1.5 Tesla. Myocardial T2 relaxation time (T2-RT) was determined by maximum likelihood estimation from magnitude phased-array multi-echo data. Four GraSE sequence variants with varying number of acquired echoes and resolution were evaluated in-vitro and in 20 healthy volunteers. Inter-study reproducibility was assessed in a subset of five volunteers. The sequence with the best overall performance was further evaluated by assessment of intra- and inter-observer agreement in all volunteers, and then implemented into the clinical CMR protocol of five patients with acute myocardial injury (myocarditis, takotsubo cardiomyopathy and myocardial infarction).

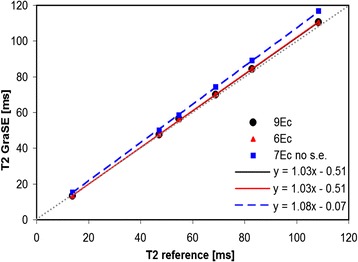
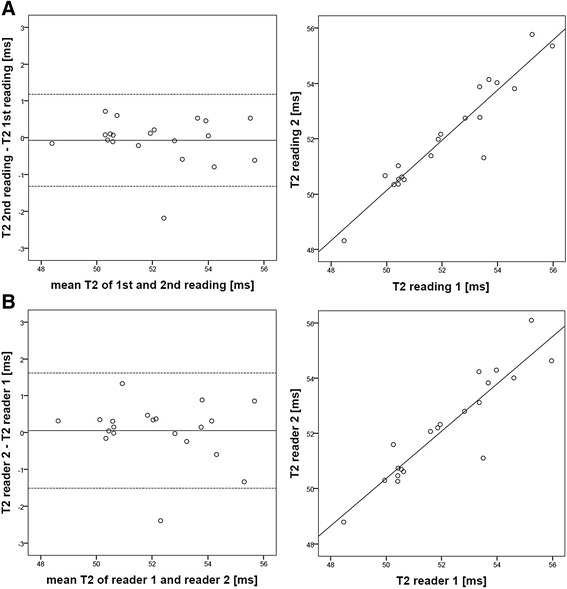
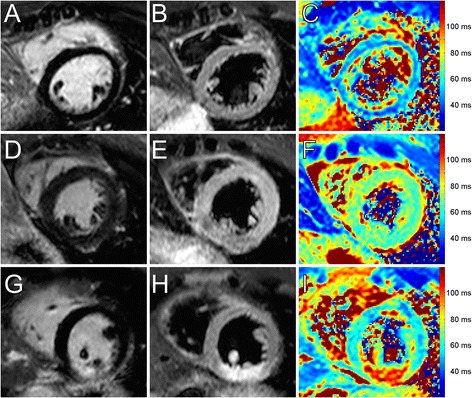
Results: In-vitro studies revealed the need for well defined sequence settings to obtain accurate T2-RT measurements with GraSE. An optimized 6-echo GraSE sequence yielded an excellent agreement with the gold standard Carr-Purcell-Meiboom-Gill sequence. Global myocardial T2 relaxation times in healthy volunteers was 52.2 ± 2.0 ms (mean ± standard deviation). Mean difference between repeated examinations (n = 5) was -0.02 ms with 95% limits of agreement (LoA) of [-4.7; 4.7] ms. Intra-reader and inter-reader agreement was excellent with mean differences of -0.1 ms, 95% LoA = [-1.3; 1.2] ms and 0.1 ms, 95% LoA = [-1.5; 1.6] ms, respectively (n = 20). In patients with acute myocardial injury global myocardial T2-RTs were prolonged (mean: 61.3 ± 6.7 ms).

Conclusion: Using an optimized GraSE sequence CMR allows for robust, reliable, fast myocardial T2 mapping and quantitative tissue characterization. Clinically, the GraSE-based T2-mapping has the potential to complement qualitative CMR in patients with acute myocardial injuries.


Figures

Figure 1
Figure 1
Results of phantom measurements. The agreement between T2 measurements using the GraSE sequence and the reference (CPMG sequence) were excellent for the 9 Echo and the 6 Echo variant with the parameter “slice profile” set to “optimal” and one start-up echo. Without start-up echo, T2 relaxation times were slightly overestimated (7Ec no s.e.). The dotted line in gray represents the line of identity corresponding to a perfect agreement with the reference.
Figure 2
Figure 2
Results of the six-echo GraSE sequence with corresponding T2 maps for a healthy 37-year-old male. Each row shows a single slice (from top to bottom: basal, mid-ventricular, apical slice) with echo-times ranging from 23.6 ms to 82.6 ms (from left to right). Data were acquired in one breath-hold per slice (12.8 s). No motion correction was applied. Color-coded T2 maps are shown in the last column and were generated based on a maximum likelihood estimation accounting for the non-Gaussian distribution of noise in magnitude images. Global myocardial T2 relaxation time in this subject was 51.6 ± 3.3 ms (basal anterior/anteroseptal/inferoseptal/inferior/inferolateral/anterolateral: 50.1/51.6/47.6/47.7/45.0/52.9 ms; midventricular anterior/anteroseptal/inferoseptal/inferior/inferolateral/anterolateral: 55.5/57.1/50.2/50.2/54.6/49.2 ms; apical anterior/septal/inferior/lateral: 54.7/54.8/49.4/54.9 ms). To ease comparison with clinical cases (see Figure 5), color-settings are kept equal throughout the article. Scale bars equal 20 mm.
Figure 3
Figure 3
Assessment of intra- and inter-reader agreement for global myocardial T2 measurements with the six-echo GraSE sequence. A: Bland-Altman analysis shows very good agreement of repeated observations for the same reader (mean difference = −0.1 ms, 95% LoA = [−1.3; 1.2] ms) with an excellent linear correlation (R = 0.95). B: The agreement of two different readers is only slightly lower (R = 0.92) than repeated readings by the same reader.
Figure 4
Figure 4
Segmental analysis of myocardial T2 relaxation time. Regional dependence of measured T2 values is illustrated using the 16 segment AHA model [20]. Slightly higher values for the T2 relaxation time of myocardium were observed in the apical segments, but with no significant difference to mid-ventricular and basal segments.
Figure 5
Figure 5
Example CMR findings. Midventricular short axis T2-weighted short tau inversion recovery (STIR), late gadolinium enhancement (LGE), and T2 mapping sequences in a 29-year-old healthy male volunteer (A, B, C), a 42-year-old patient (#1) with acute, diffuse myocarditis (D, E, F), and a 53-year-old patient (#2) with acute myocardial infarction (G, H, I). Mean global T2 relaxation time for the healthy volunteer was 48.5 ± 4.6 ms (anterior: 47.8 ms; anteroseptal: 57.8 ms; inferoseptal: 52.1 ms; inferior: 49.6 ms; inferolateral: 45.5 ms; anterolateral: 47.1 ms) (C). In patient #1 diffuse myocardial edema was present throughout all myocardial segments (D, E, F), associated with increased global T2 values of 68.0 ± 2.4 ms (anterior: 65.4 ms; anteroseptal: 68.4 ms; inferoseptal: 70.5 ms; inferior: 65.8 ms; inferolateral: 64.4 ms; anterolateral: 66.1 ms). Patient #2 showed an acute myocardial infarction of the inferior segments with subendocardial LGE (G) and pronounced edema in the T2 STIR image (H). Pronounced myocardial edema is also visible in the corresponding T2 map (I), where the infarcted segments showed mean T2 relaxation times of 89.4 ms (inferior) and 82.3 ms (inferolateral) (anterior: 55.5 ms; anteroseptal: 56.2 ms; inferoseptal: 70.5 ms; anterolateral: 66.1 ms; global T2 relaxation time: 62.5 ± 13.1 ms).

References

    1. Ferreira VM, Piechnik SK, Dall’Armellina E, Karamitsos TD, Francis JM, Choudhury RP, et al. Non-contrast T1-mapping detects acute myocardial edema with high diagnostic accuracy: a comparison to T2-weighted cardiovascular magnetic resonance. J Cardiovasc Magn Reson. 2012;14:42. doi: 10.1186/1532-429X-14-42. - DOI - PMC - PubMed
    1. Luetkens JA, Doerner J, Thomas DK, Dabir D, Gieseke J, Sprinkart AM et al. Acute myocarditis: multiparametric cardiac MR imaging. Radiology. 2014;273(2):383-392. - PubMed
    1. Higgins CB, Herfkens R, Lipton J, Sievers R, Sheldon P, Kaufman L, et al. Nuclear magnetic resonance imaging of acute myocardial infarction in dogs: alterations in magnetic relaxation times. Am J Cardiol. 1983;52:184–188. doi: 10.1016/0002-9149(83)90093-0. - DOI - PubMed
    1. Eitel I, Friedrich MG. T2-weighted cardiovascular magnetic resonance in acute cardiac disease. J Cardiovasc Magn Reson. 2011;13:13. doi: 10.1186/1532-429X-13-13. - DOI - PMC - PubMed
    1. Abdel-Aty H, Simonetti O, Friedrich MG. T2-weighted cardiovascular magnetic resonance imaging. J Magn Reson Imaging. 2007;26:452–459. doi: 10.1002/jmri.21028. - DOI - PubMed

Publication types

MeSH terms