

How has peritoneal dialysis changed over the last 30 years: experience of the Verona dialysis center
- PMID: 25885318
- PMCID: PMC4404116
- DOI: 10.1186/s12882-015-0051-3
How has peritoneal dialysis changed over the last 30 years: experience of the Verona dialysis center
Abstract
Background: The last decade has witnessed considerable improvement in dialysis technology and changes in clinical management of patients in peritoneal dialysis (PD) with a significant impact on long term clinical outcomes. However, the identification of factors involved in this process is still not complete.
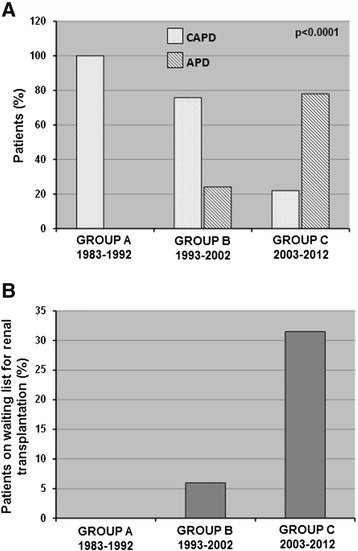
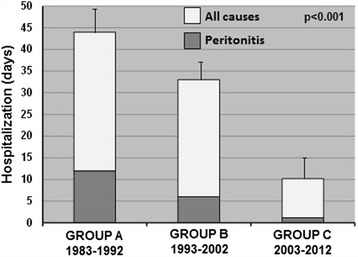
Methods: Therefore, to assess this objective, we retrospectively analyzed clinical records of 260 adult patients who started PD treatment from 1983 to 2012 in our renal unit. For the analysis, we divided them into three groups according to the time of starting dialysis: GROUP A (n: 62, 1983-1992), GROUP B (n: 66, 1993-2002) and GROUP C (n: 132, 2003 to 2012).
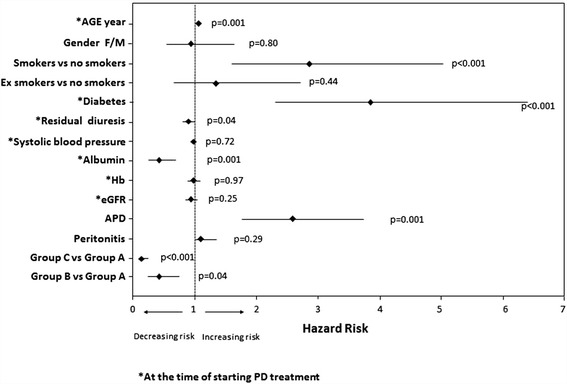
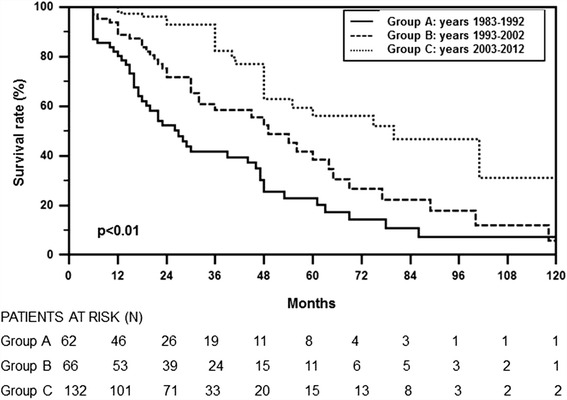
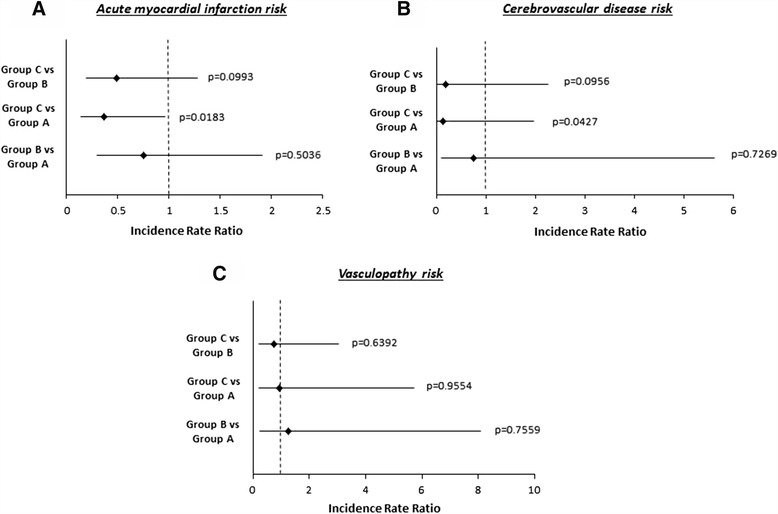
Results: Statistical analysis revealed that patients included in the GROUP C showed a reduction in mean patients' age (p = 0.03), smoking habit (p = 0.001), mean systolic blood pressure (p < 0.0001) and an increment in hemoglobin levels (p < 0.0001) and residual diuresis (p = 0.016) compared to the other two study groups. Additionally, patients included in GROUP C, mainly treated with automated peritoneal dialysis, showed a reduced risk of all-causes mortality and a decreased risk to develop acute myocardial infarction and cerebrovascular disease. Patients' age, diabetes mellitus and smoking habit were all positively associated with a significant increased risk of mortality in our PD patients, while serum albumin levels and residual diuresis were negatively correlated.
Conclusions: Therefore, the present study, revealed that in the last decade there has been a growth of our PD program with a concomitant modification of our patients' characteristics. These changes, together with the evident technical advances, have caused a significant improvement of patients' survival and a decrement of the rate of hospitalization. Moreover, it reveals that our pre-dialysis care, modifying the above-mentioned factors, has been a major cause of these clinical improvements.
Figures
References
-
- National Kidney Foundation K/DOQI clinical practice guidelines for chronic kidney disease: evaluation, classification, and stratification. Am J Kidney Dis. 2002;392(Suppl 1):S1–266. - PubMed
-
- Biesenbach G, Pohanka E. Dialysis in diabetic patients: hemodialysis and peritoneal dialysis. Pros Cons Minerva Uro lNefrol. 2012;64(3):173–82. - PubMed
-
- Cabiddu G, Marinangeli G. Censimento 2012 del Gruppo di Studio di Dialisi Peritoneale. http://www.dialisiperitoneale.org/web/eventi/GDS/censimento.cfm
Publication types
MeSH terms
LinkOut - more resources
Full Text Sources
Other Literature Sources
Medical
