. 2015 Feb 13:15:51.
doi: 10.1186/s12885-015-1047-x.

Impact of diabetes type II and chronic inflammation on pancreatic cancer

Affiliations

Impact of diabetes type II and chronic inflammation on pancreatic cancer

Dietmar Zechner et al. BMC Cancer. .

Abstract

Background: We explored if known risk factors for pancreatic cancer such as type II diabetes and chronic inflammation, influence the pathophysiology of an established primary tumor in the pancreas and if administration of metformin has an impact on tumor growth.

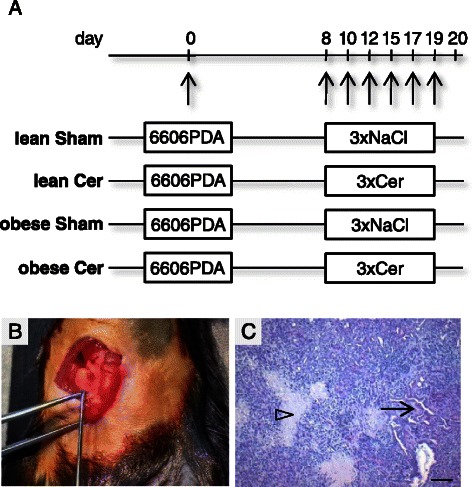
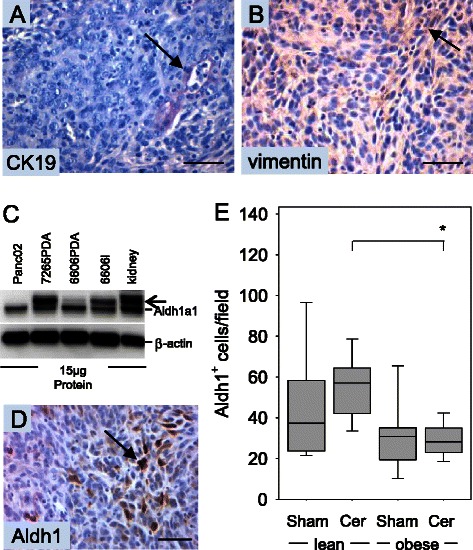
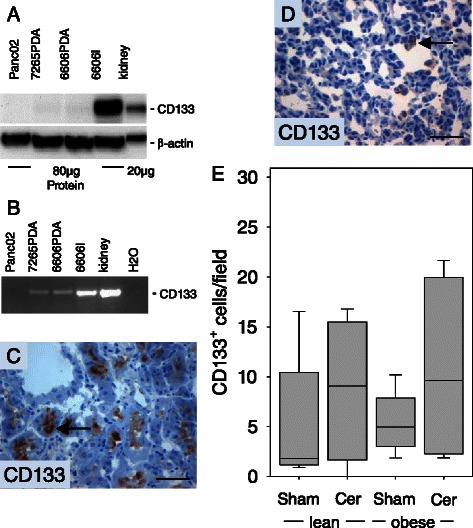
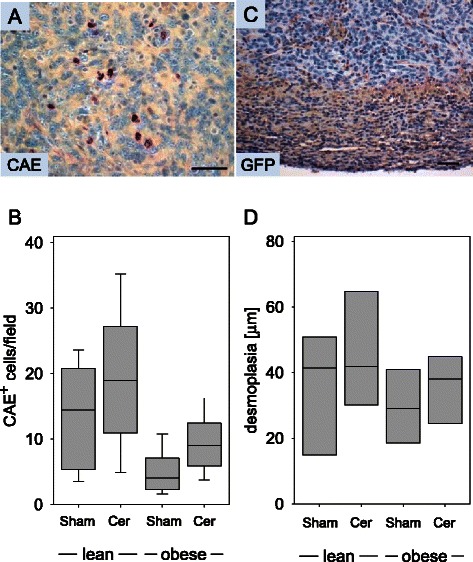
Methods: Pancreatic carcinomas were assessed in a syngeneic orthotopic pancreas adenocarcinoma model after injection of 6606PDA cells in the pancreas head of either B6.V-Lep(ob/ob) mice exhibiting a type II diabetes-like syndrome or normoglycemic mice. Chronic pancreatitis was then induced by repetitive administration of cerulein. Cell proliferation, cell death, inflammation and the expression of cancer stem cell markers within the carcinomas was evaluated by immunohistochemistry. In addition, the impact of the antidiabetic drug, metformin, on the pathophysiology of the tumor was assessed.

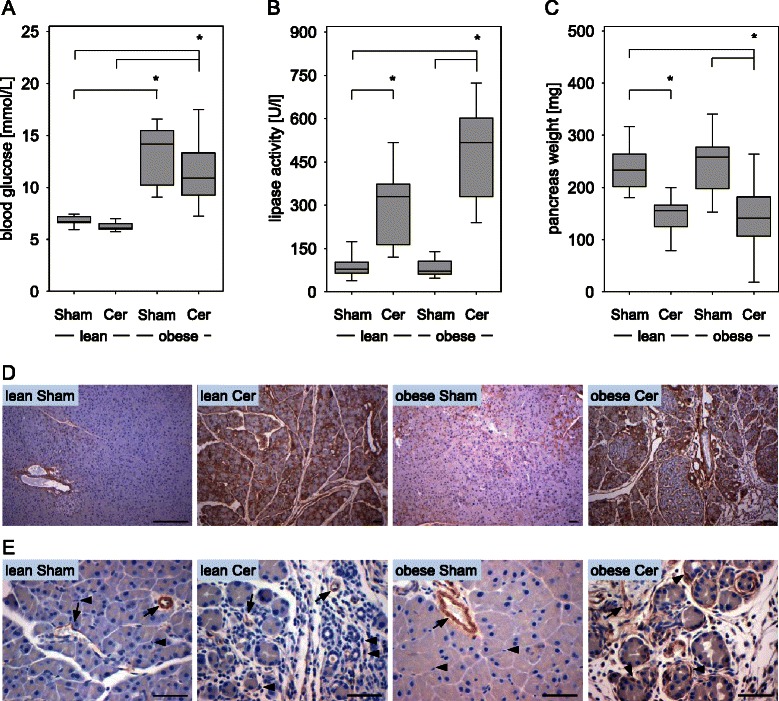
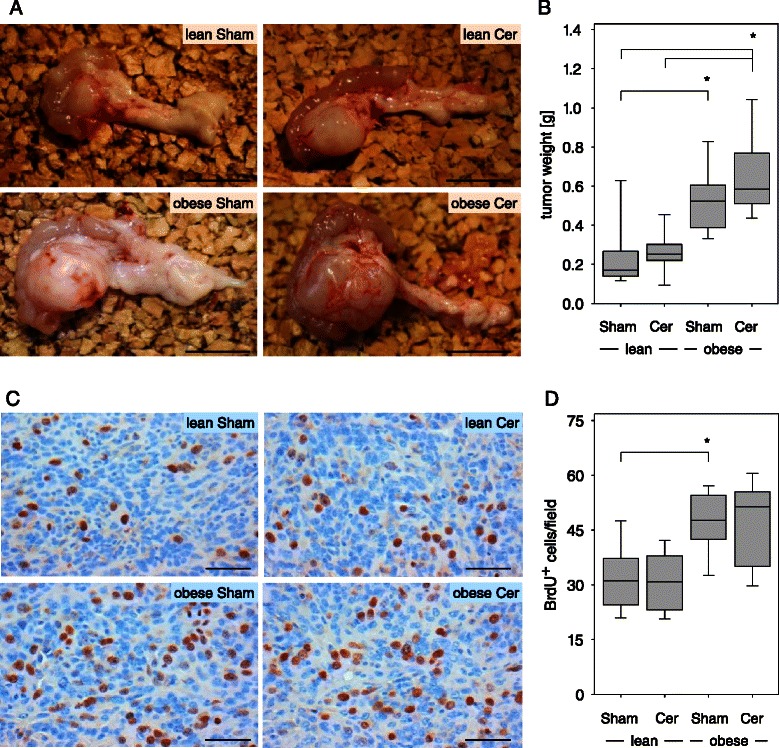
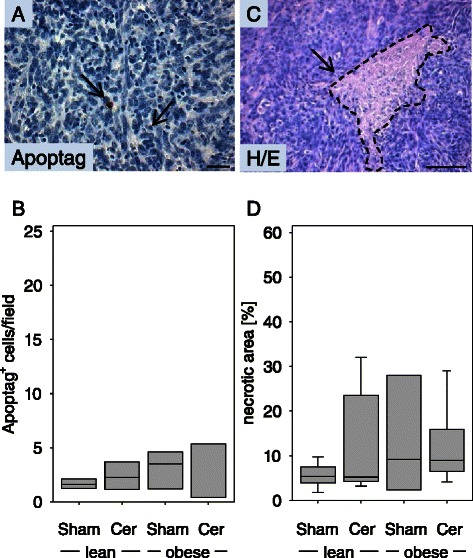
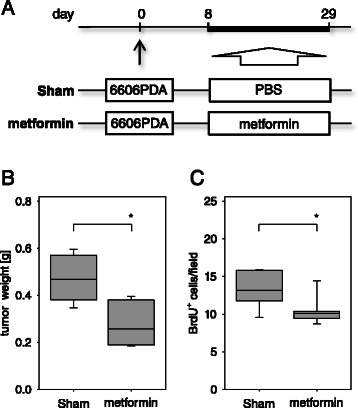
Results: Diabetic mice developed pancreatic ductal adenocarcinomas with significantly increased tumor weight when compared to normoglycemic littermates. Diabetes caused increased proliferation of cancer cells, but did not inhibit cancer cell necrosis or apoptosis. Diabetes also reduced the number of Aldh1 expressing cancer cells and moderately decreased the number of tumor infiltrating chloracetate esterase positive granulocytes. The administration of metformin reduced tumor weight as well as cancer cell proliferation. Chronic pancreatitis significantly diminished the pancreas weight and increased lipase activity in the blood, but only moderately increased tumor weight.

Conclusion: We conclude that diabetes type II has a fundamental influence on pancreatic ductal adenocarcinoma by stimulating cancer cell proliferation, while metformin inhibits cancer cell proliferation. Chronic inflammation had only a minor effect on the pathophysiology of an established adenocarcinoma.


Figures

Figure 1
Figure 1
Characterisation of the syngeneic orthotopic PDA model. (A) 6606PDA cells were injected on day 0 into the head of the pancreas of non-diabetic (lean) or diabetic (obese) mice. Chronic pancreatitis was induced by ip injection of cerulein in non-diabetic (lean Cer) and diabetic (obese Cer) cohorts of mice three times a day on the indicated days, whereas control non-diabetic (lean Sham) and diabetic (obese Sham) mice received 0.9% saline solution. Tissue samples were analyzed on day 20. (B) The correct injection of carcinoma cells could macroscopically be verified. (C) A representative histology of a PDA reveals necrotic areas (arrowhead), but also vital cells with partially epithelial morphology (arrow). Bar = 50 μm.
Figure 2
Figure 2
Characterisation of diabetes and pancreatitis. (A) The average blood glucose concentration of two measurements per mouse (day 0 and day 20) for each cohort is given for sham treated non-diabetic (lean Sham) or diabetic (obese Sham) mice and in cerulein treated non-diabetic (lean Cer) or diabetic (obese Cer) animals. (B) Comparison of the lipase activity in the blood between the four cohorts indicates induction of pancreatitis on day 8. (C) Evaluation of the pancreas weight on day 20 indicates pancreatic atrophy after induction of chronic pancreatitis. (D) Immunohistochemistry on day 20 indicates collagen I deposition (brown colour) in the pancreas after cerulein induced chronic pancreatitis in lean and obese mice. (E) Evaluation of α-smooth muscle actin expression by immunohistochemistry (brown colour) on day 20 indicates moderate activation of periacinar stellate cells by cerulein in lean mice and strong activation in obese mice (arrows point at blood vessels, arrowheads point at stellate cells). Box plots indicate the median, the 25th and 75th percentiles in the form of a box, and the 10th and 90th percentiles as whiskers. The number of animals evaluated was n = 11 (lean Sham), n = 10 (lean Cer), n = 11 (obese Sham), n = 13 (obese Cer). Significant differences between the cohorts are indicated, *P ≤ 0.006. Bars = 50 μm.
Figure 3
Figure 3
Diabetes leads to increased tumor weight and enhanced cancer cell proliferation on day 20. (A) Representative images of isolated pancreas with a carcinoma shows obvious differences in tumor size in sham treated non-diabetic (lean Sham) or diabetic (obese Sham) mice and in cerulein treated non-diabetic (lean Cer) or diabetic (obese Cer) animals. (B) Quantification of the tumor weight in the indicated mouse cohorts. (C) Representative images of histological sections after BrdU immunohistochemistry. (D) Quantification of BrdU+ nuclei within the carcinoma reveals increased proliferation of cancer cells in diabetic mice. Box plots indicate the median, the 25th and 75th percentiles in the form of a box, and the 10th and 90th percentiles as whiskers. The number of animals evaluated was n = 11 (lean Sham), n = 10 (lean Cer), n = 11 (obese Sham), n = 13 (obese Cer). Significant differences between the cohorts are indicated, *P ≤ 0.002 (B), *P = 0.005 (D). Bar =1 cm (A) or 50 μm (C).
Figure 4
Figure 4
Diabetes does not inhibit cell death in PDA on day 20. (A) Representative image of an Apoptag+ cell. (B) Quantification of apoptotic cell death in the carcinomas of sham treated non-diabetic (lean Sham) or diabetic (obese Sham) mice and in the carcinomas of cerulein treated non-diabetic (lean Cer) or diabetic (obese Cer) animals. (C) Representative image of a necrotic area. (D) Comparison of the percentage of necrotic tissue area in the carcinomas of the indicated mouse cohorts. Box plots indicate the median, the 25th and 75th percentiles in the form of a box, and the 10th and 90th percentiles as whiskers. The number of animals evaluated was n = 4 (lean Sham), n = 4 (lean Cer), n = 3 (obese Sham), n = 4 (obese Cer) in panel B and n = 7 (lean Sham), n = 7 (lean Cer), n = 3 (obese Sham), n = 6 (obese Cer) in panel D. Differences between the cohorts were not significant. Bar = 50 μm.
Figure 5
Figure 5
Analysis of CK19, vimentin and Aldh1a1 expression. (A) Representative images of epithelial cells expressing cytokeratin 19 and (B) of non-epithelial cells expressing vimentin in 6606PDA derived carcinomas. (C) Analysis of Aldh1a1 expression in cultured PDA cell lines and kidney by Western Blotting. An additional band (arrow) is observed in some cell lines and kidney cell extract and might represent another Aldh family member; e.g. Aldh1a3. (D) Immunohistochemistry of 6606PDA derived carcinomas reveals expression of the cancer stem cell marker, Aldh1, in some cancer cells. (E) Quantification of Aldh1+ cells in the carcinomas of sham treated non-diabetic (lean Sham) or diabetic (obese Sham) mice and in the carcinomas of cerulein treated non-diabetic (lean Cer) or diabetic (obese Cer) animals. Box plots indicate the median, the 25th and 75th percentiles in the form of a box, and the 10th and 90th percentiles as whiskers. The number of animals evaluated was n = 9 (lean Sham), n = 9 (lean Cer), n = 9 (obese Sham), n = 10 (obese Cer). Significant differences between the cohorts are indicated, *P = 0.003. The Western Blot results were reproduced by three independent experiments. Bars = 50 μm.
Figure 6
Figure 6
Analysis of CD133 expression. (A) Analysis of CD133 expression in cultured 6606PDA cells and kidney by Western Blotting. (B) Analysis of CD133 expression in cultured PDA cell lines and kidney by PCR. (C) The positive control for CD133 immunohistochemistry reveals expression of CD133 (arrow) in epithelial cells of proximal tubuli. (D) Immunohistochemistry of 6606PDA derived carcinomas reveals expression of CD133 (arrow) in some cancer cells. (E) Quantification of CD133+ cells in the carcinomas of sham treated non-diabetic (lean Sham) or diabetic (obese Sham) mice and in the carcinomas of cerulein treated non-diabetic (lean Cer) or diabetic (obese Cer) animals. Box plots indicate the median, the 25th and 75th percentiles in the form of a box, and the 10th and 90th percentiles as whiskers. The number of animals evaluated was n = 5 (lean Sham), n = 4 (lean Cer), n = 6 (obese Sham), n = 6 (obese Cer). Differences between the cohorts were not significant. The Western Blot results were reproduced by three independent experiments. Bars = 50 μm.
Figure 7
Figure 7
Analysis of inflammation and desmoplasia on day 20. (A) Representative image of CAE+ inflammatory cells in PDA. (B) Quantification of CAE+ cells in the carcinomas of sham treated non-diabetic (lean Sham) or diabetic (obese Sham) mice and in the carcinomas of cerulein treated non-diabetic (lean Cer) or diabetic (obese Cer) animals. (C) Desmoplastic reaction visualized by anti-GFP immunohistochemistry in a C57BL6-TgACTB-eGFP1Osb/J mouse, which ubiquitously expresses GFP. (D) Quantification of α-smooth muscle+ desmoplastic reaction surrounding the carcinomas in sham treated non-diabetic (lean Sham) or diabetic (obese Sham) mice and in the carcinomas of cerulein treated non-diabetic (lean Cer) or diabetic (obese Cer) animals. Box plots indicate the median, the 25th and 75th percentiles in the form of a box, and the 10th and 90th percentiles as whiskers. The number of animals evaluated was n = 11 (lean Sham), n = 9 (lean Cer), n = 9 (obese Sham), n = 12 (obese Cer) in Panel B and n = 4 for each cohort in Panel D. Bar = 50 μm.
Figure 8
Figure 8
Metformin reduces tumor weight and cancer cell proliferation. (A) 6606PDA cells were injected on day 0 into the pancreas of C57BL/6J mice. Between day 8 and day 29 PBS (Sham) or metformin was ip injected daily and tissue samples were analyzed on day 29. (B) Quantification of the tumor weight in the indicated mouse cohorts. (C) Quantification of BrdU+ nuclei within the carcinoma reveals that metformin treatment reduces cell proliferation. Box plots indicate the median, the 25th and 75th percentiles in the form of a box, and the 10th and 90th percentiles as whiskers. The number of animals evaluated was n = 8 (Sham) and n = 7 (metformin), Significant differences between the cohorts are indicated, *P = 0.004 (B), *P = 0.029 (C).

References

    1. Siegel R, Naishadham D, Jemal A. Cancer statistics, 2013. CA Cancer J Clin. 2013;63(1):11–30. doi: 10.3322/caac.21166. - DOI - PubMed
    1. Meacham CE, Morrison SJ. Tumour heterogeneity and cancer cell plasticity. Nature. 2013;501(7467):328–37. doi: 10.1038/nature12624. - DOI - PMC - PubMed
    1. Balic A, Dorado J, Alonso-Gomez M, Heeschen C. Stem cells as the root of pancreatic ductal adenocarcinoma. Exp Cell Res. 2012;318(6):691–704. doi: 10.1016/j.yexcr.2011.11.007. - DOI - PubMed
    1. Podberezin M, Wen J, Chang CC. Cancer stem cells: a review of potential clinical applications. Arch Pathol Lab Med. 2012;137(8):1111–6. doi: 10.5858/arpa.2012-0494-RA. - DOI - PubMed
    1. Feldmann G, Dhara S, Fendrich V, Bedja D, Beaty R, Mullendore M, et al. Blockade of hedgehog signaling inhibits pancreatic cancer invasion and metastases: a new paradigm for combination therapy in solid cancers. Cancer Res. 2007;67(5):2187–96. doi: 10.1158/0008-5472.CAN-06-3281. - DOI - PMC - PubMed

Publication types

MeSH terms

LinkOut - more resources