Clinical Trial
. 2015 Feb 6:13:51.
doi: 10.1186/s12967-015-0420-5.

Calcineurin inhibitors differentially alter the circadian rhythm of T-cell functionality in transplant recipients

Affiliations
Clinical Trial

Calcineurin inhibitors differentially alter the circadian rhythm of T-cell functionality in transplant recipients

Sarah Leyking et al. J Transl Med. .

Abstract

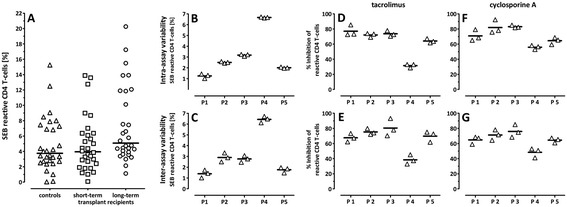
Background: Graft survival in transplant recipients depends on pharmacokinetics and on individual susceptibility towards immunosuppressive drugs. Nevertheless, pharmacodynamic changes in T-cell functionality in response to drugs and in relation to pharmacokinetics are poorly characterized. We therefore investigated the immunosuppressive effect of calcineurin inhibitors and steroids on general T-cell functionality after polyclonal stimulation of whole blood samples.

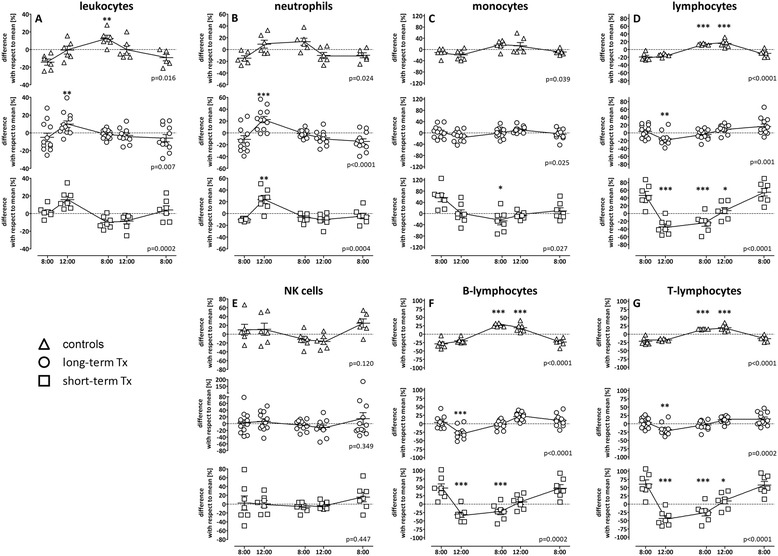
Methods: General T-cell functionality in the absence or presence of immunosuppressive drugs was determined in vitro directly from whole blood based on cytokine induction after stimulation with the polyclonal stimulus Staphylococcus aureus enterotoxin B. In addition, diurnal changes in leukocyte and lymphocyte subsets, and on T-cell function after intake of immunosuppressive drugs were analyzed in 19 patients during one day and compared to respective kinetics in six immunocompetent controls. Statistical analysis was performed using non-parametric and parametric tests.

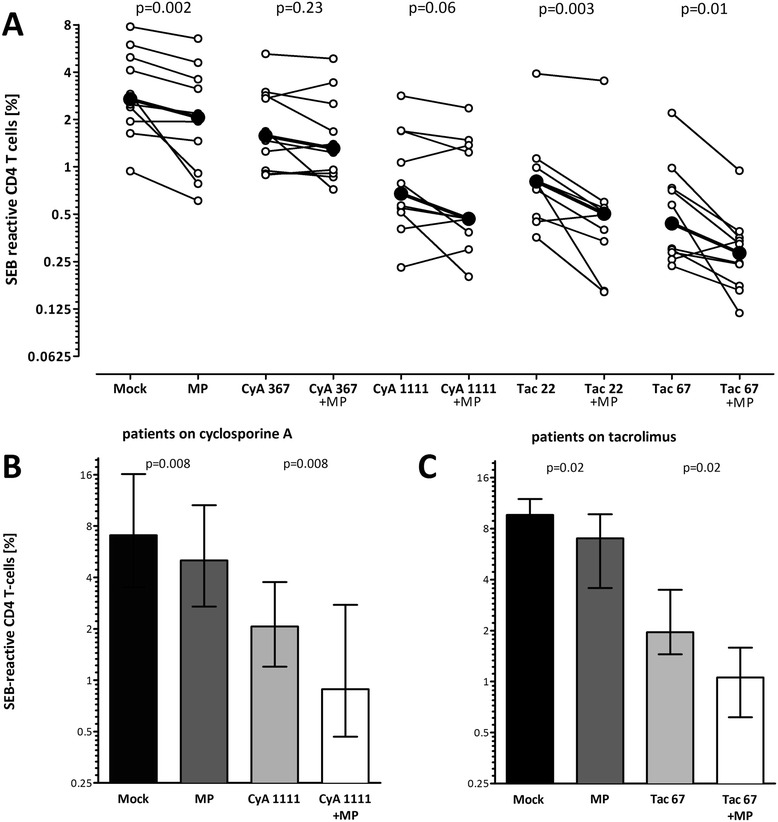
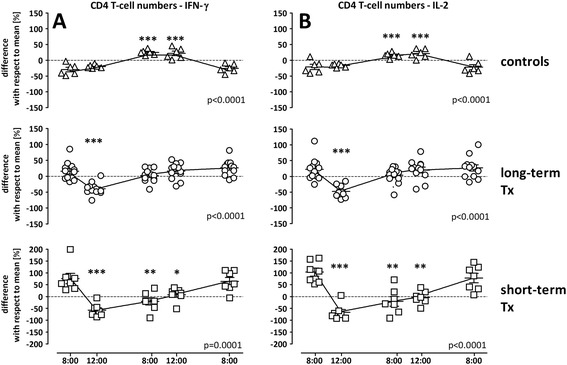
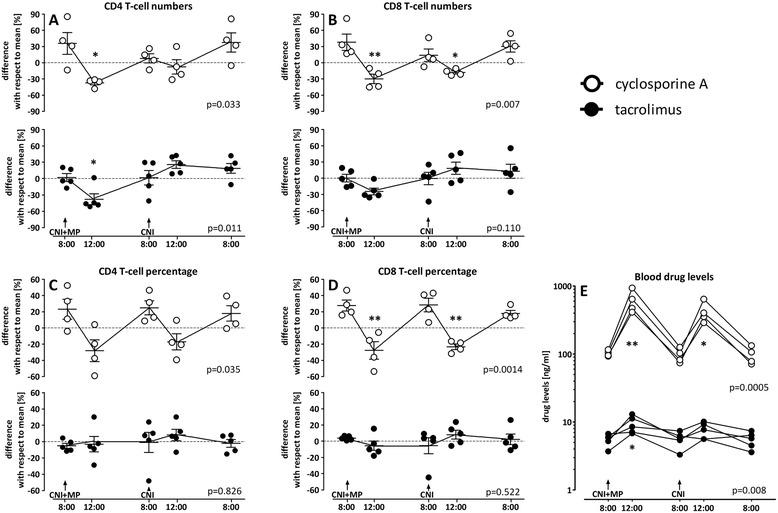
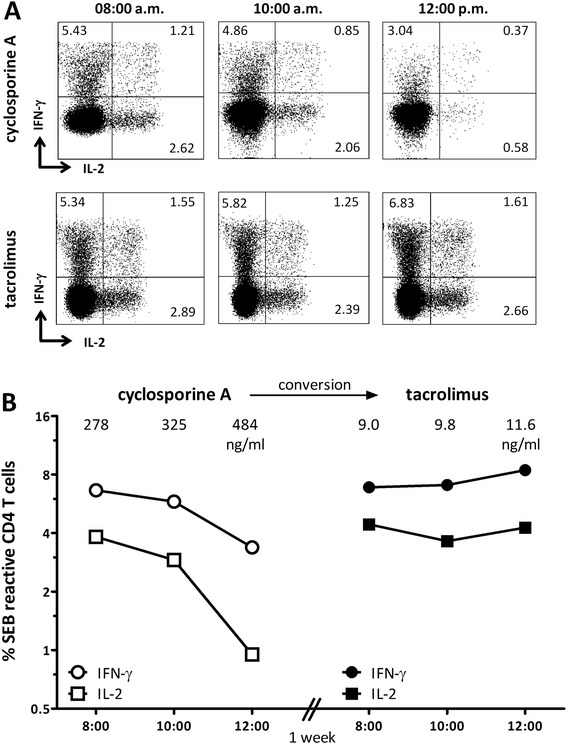
Results: Susceptibility towards calcineurin inhibitors showed interindividual differences. When combined with steroids, tacrolimus led to more pronounced increase in the inhibitory activity as compared to cyclosporine A. While circadian alterations in leukocyte subpopulations and T-cell function in controls were related to endogenous cortisol levels, T-cell functionality in transplant recipients decreased after intake of the morning medication, which was more pronounced in patients with higher drug-dosages. Interestingly, calcineurin inhibitors differentially affected circadian rhythm of T-cell function, as patients on cyclosporine A showed a biphasic decrease in T-cell reactivity after drug-intake in the morning and evening, whereas T-cell reactivity in patients on tacrolimus remained rather stable.

Conclusions: The whole blood assay allows assessment of the inhibitory activity of immunosuppressive drugs in clinically relevant concentrations. Circadian alterations in T-cell function are determined by dose and type of immunosuppressive drugs and show distinct differences between cyclosporine A and tacrolimus. In future these findings may have practical implications to estimate the net immunosuppressive effect of a given drug-regimen that daily acts in an individual patient, and may contribute to individualize immunosuppression.


Figures

Figure 1
Figure 1
Interindividual variability and intraindividual stability in T-cell function and different susceptibility towards calcineurin inhibitors. (A) Inter-individual variability of SEB-reactive T-cell frequencies in 30 healthy controls (50.27 ± 13.5 years of age; 15 females), 30 short-term (51.71 ± 12.80 years of age; 15 females) and 30 long-term transplanted patients (50.16 ± 13.31 years of age; 14 females) is shown. Medians are indicated by horizontal lines and did not differ between the groups (Kruskal-Wallis test with Dunn’s post test). Intra- and inter-assay variability in SEB-reactive T-cell frequencies stimulated from blood samples of five healthy volunteers (P1-P5; 35.34 ± 5.54 years of age; 2 females) in the absence (B and C) or presence of 67 ng/ml tacrolimus (D and E) or 1111 ng/ml cyclosporine A (F and G). Intra-assay variability of T-cell reactivity was determined by repeated measurements of the same blood sample (B, D, and F). Inter-assay variability of T-cell reactivity was determined in three independently collected blood samples (0, two and six weeks; C, E, and G). The inhibitory effect on T-cells by calcineurin inhibitors was compared in relation to the samples treated without drugs. All drugs were solved in ethanol. Mean values are indicated as horizontal lines in panels B-G.
Figure 2
Figure 2
Steroids show a combined inhibitory activity with tacrolimus and to a lesser extent with cyclosporine A. (A) Whole blood samples of healthy individuals (n = 10; 22.3 ± 3.2 years; 6 females) were stimulated with SEB in the absence (Mock) or presence of cyclosporine A (CyA, 367 ng/ml and 1111 ng/ml, respectively) or tacrolimus (Tac, 22 ng/ml and 67 ng/ml, respectively) with and without steroids (MP). Bold dots represent the means connected by lines. (B) Whole blood samples of long-term transplanted patients on cyclosporine A (n = 8; 46.2 ± 12.8 years; 2 females) and (C) on tacrolimus (n = 8; 47.3 ± 13.4 years; 2 females) were stimulated with SEB in the absence of immunosuppressive drugs (mock) or high dose methylprednisolone (MP, 1000 ng/ml), cyclosporine A (1111 ng/ml) or tacrolimus (67 ng/ml) as well as respective combinations. Low dose calcineurin inhibitors were not analyzed in addition, as blood from patients already included trough levels due to immunosuppressive drug-treatment. Statistical analysis was performed using the Wilcoxon t-test. Data are expressed as median with interquartile range.
Figure 3
Figure 3
Controls and transplant recipients differ in the circadian rhythm of cell counts. Circadian rhythm of (A) leukocytes and their subpopulations, namely (B) neutrophils, (C) monocytes, (D) lymphocytes and their subpopulations (E) NK-cells, (F) B- and (G) T-lymphocytes in peripheral blood of healthy controls (n = 6), long-term (n = 12) and short-term transplanted patients (n = 7) was determined over 24 hours at 8:00 a.m., 12:00 p.m., 8:00 p.m., 12:00 a.m. and the following day at 8:00 a.m. Shown are the differences in cell numbers with respect to the mean that was calculated from all values analyzed over the 24 h-time period (stippled line). The variance of cell populations at each time point with respect to this 24 h-mean is expressed as mean ± standard error of the mean. Statistical analysis was performed using the repeated measures ANOVA with Tukey’s post-test. Statistically significant differences are indicated with respect to the initial 8:00 a.m. sample. * p < 0.05, ** p < 0.01, *** p < 0.001.
Figure 4
Figure 4
Differential circadian rhythm of T-cell function in transplant recipients and healthy controls. Circadian rhythm of SEB-reactive CD4 T-cell numbers in peripheral blood of healthy controls (n = 6), long-term (n = 12) and short-term transplanted patients (n = 7) was determined over 24 hours at 8:00 a.m., 12:00 p.m., 8:00 p.m., 12:00 a.m. and the following day 8:00 a.m. Shown are the differences in absolute cell numbers of IFN-γ positive (A) and IL-2 positive (B) CD4 T-cells with respect to the mean that was calculated from all values analyzed over the 24 h-time period (stippled line). The variance of cytokine-producing T-cells at each time point with respect to this 24 h-mean is expressed as mean ± standard error of the mean. Statistical analysis was performed using the repeated measures ANOVA with Tukey’s post-test. Statistically significant differences are indicated with respect to the initial 8:00 a.m. sample. *p < 0.05, **p < 0.01, ***p < 0.001.
Figure 5
Figure 5
Cyclosporine A and tacrolimus differentially affect circadian rhythms in T-cell reactivity. Circadian rhythm of SEB-stimulated CD4 and CD8 T-cells in the peripheral blood of long-term transplanted patient taking cyclosporine A (n = 4) or tacrolimus (n = 5) determined over 24 hours at 8:00 a.m., 12:00 p.m., 8:00 p.m., 12:00 a.m. and the following day 8:00 a.m. Shown are the differences in absolute cell numbers of IFN-γ positive (A) CD4 and (B) CD8 T-cells with respect to the mean that was calculated from all values analyzed over the 24 h-time period (stippled line). In addition, relative CD4 (C) and CD8 (D) T-cell frequencies are shown. The variance of cytokine-producing T-cells at each time point with respect to this 24 h-mean is expressed as mean ± standard error of the mean. (E) Corresponding levels of calcineurin inhibitors in ng/ml determined from peripheral blood of the patients. Statistical analysis was performed using the repeated measures ANOVA with Tukey’s post-test. Statistically significant differences are indicated with respect to the 8:00 a.m. and 8:00 p.m. samples after drug-intake. The intake of calcineurin inhibitors (CNI) alone or in combination with methylprednisolone (MP) is indicated. *p < 0.05, **p < 0.01.
Figure 6
Figure 6
T-cell function after drug-intake shows different dynamics after conversion from cyclosporine A to tacrolimus. (A) Dot plots above show SEB-stimulated CD4 T-cells producing IL-2 (upper left quadrant) or IFN-γ (lower right quadrant) or both cytokines (upper right quadrant) before (8:00 a.m.) and after (10:00 a.m. and 12:00 p.m.) intake of cyclosporine A (upper panel) or tacrolimus (lower panel). Percentages of reactive CD4 T-cells are indicated in the corresponding quadrants. Kinetics of SEB-reactive T-cells producing the cytokine IFN-γ (circles, corresponding to cells in the two upper quadrants) and IL-2 (squares, corresponding to cells in the two right quadrants) at 8:00 a.m., 10:00 a.m. and 12:00 p.m. under cyclosporine A and after conversion to tacrolimus are shown in panel (B). Corresponding drug-levels are indicated.

Similar articles

Cited by

References

    1. Sommerer C, Giese T, Meuer S, Zeier M. Pharmacodynamic monitoring of calcineurin inhibitor therapy: is there a clinical benefit? Nephrol Dial Transplant. 2009;24(1):21–7. doi: 10.1093/ndt/gfn556. - DOI - PubMed
    1. van Rossum HH, de Fijter JW, van Pelt J. Pharmacodynamic monitoring of calcineurin inhibition therapy: principles, performance, and perspectives. Ther Drug Monit. 2010;32(1):3–10. doi: 10.1097/FTD.0b013e3181c0eecb. - DOI - PubMed
    1. Egli A, Kohli S, Dickenmann M, Hirsch HH. Inhibition of polyomavirus BK-specific T-Cell responses by immunosuppressive drugs. Transplantation. 2009;88(10):1161–8. doi: 10.1097/TP.0b013e3181bca422. - DOI - PubMed
    1. Sester U, Gärtner BC, Wilkens H, Schwaab B, Wössner R, Kindermann I, et al. Differences in CMV-specific T-cell levels and long-term susceptibility to CMV infection after kidney, heart and lung transplantation. Am J Transplant. 2005;5(6):1483–9. doi: 10.1111/j.1600-6143.2005.00871.x. - DOI - PubMed
    1. Sester U, Wilkens H, van Bentum K, Singh M, Sybrecht GW, Schäfers HJ, et al. Impaired detection of Mycobacterium tuberculosis immunity in patients using high levels of immunosuppressive drugs. Eur Respir J. 2009;34(3):702–10. doi: 10.1183/09031936.00013409. - DOI - PubMed

Publication types

LinkOut - more resources