. 2015 Apr 17;11(4):e1005148.
doi: 10.1371/journal.pgen.1005148. eCollection 2015 Apr.

Transgenerational inheritance of diet-induced genome rearrangements in Drosophila

Affiliations

Transgenerational inheritance of diet-induced genome rearrangements in Drosophila

John C Aldrich et al. PLoS Genet. .

Abstract

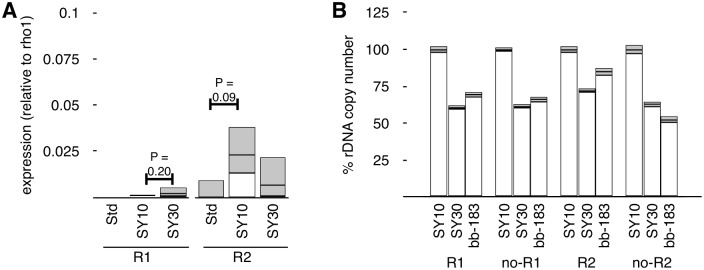
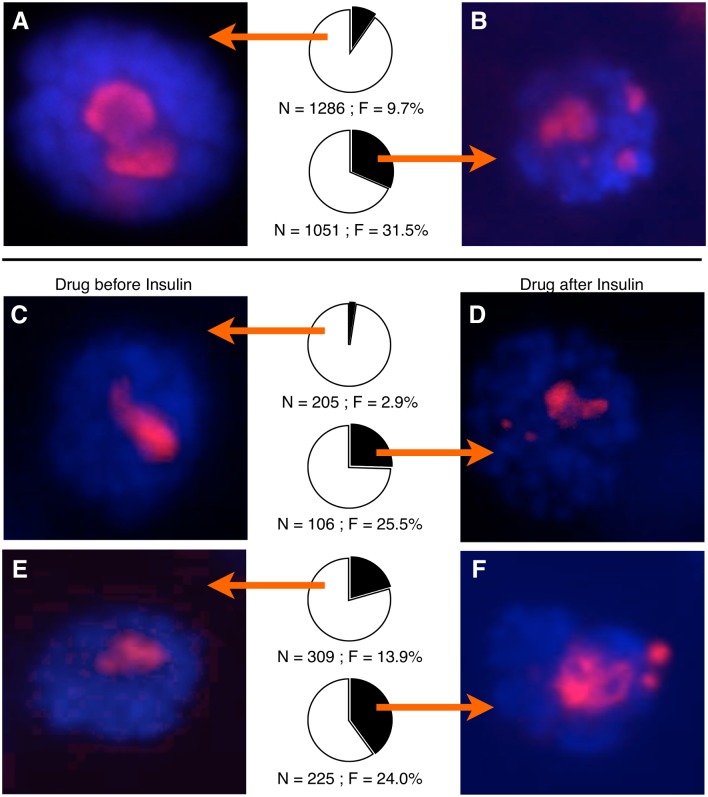
Ribosomal RNA gene (rDNA) copy number variation modulates heterochromatin formation and influences the expression of a large fraction of the Drosophila genome. This discovery, along with the link between rDNA, aging, and disease, high-lights the importance of understanding how natural rDNA copy number variation arises. Pursuing the relationship between rDNA expression and stability, we have discovered that increased dietary yeast concentration, emulating periods of dietary excess during life, results in somatic rDNA instability and copy number reduction. Modulation of Insulin/TOR signaling produces similar results, indicating a role for known nutrient sensing signaling pathways in this process. Furthermore, adults fed elevated dietary yeast concentrations produce offspring with fewer rDNA copies demonstrating that these effects also occur in the germline, and are transgenerationally heritable. This finding explains one source of natural rDNA copy number variation revealing a clear long-term consequence of diet.


Conflict of interest statement

The authors have declared that no competing interests exist.

Figures

Fig 1
Fig 1. Larval diet influences rDNA activity and stability.
(A) Real time PCR quantification of cDNAs derived from unprocessed (ETS-18S junction) pre-rRNA from larvae fed either SY10 or SY30 diets. Values were normalized to the genomic DNA copies of tRNAK-CTT genes and proportions plotted relative to Standard-fed larvae (defined as 100%). Error bars report standard deviation of RNA quantities derived from five independent pools of larvae for each condition, and indicate differences between populations exposed to altered dietary source. Although population distributions (shown) overlap, average rRNA expressions of SY10 vs SY30 differ. (B) Gallery of representative salivary gland nuclei obtained from SY10-fed larvae. Frequency of nuclei with multiple nucleoli was 7% ± 6% (S.D.), N = 337. α-Fibrillarin stains nucleoli red, DAPI stains DNA blue. (C) Gallery of representative salivary gland nuclei obtained from SY30-fed larvae, stained as in (B). Frequency of nuclei with multiple nucleoli was 40% ± 24% (S.D.), N = 522. (D) Real-time quantitative PCR analysis of 35S rDNA copy number in adult males raised on SY10 or SY30 as larvae. Percentages calculated relative to isogenic flies raised on standard food (defined as 100%). Error bars are standard deviation of three independent biological replicates and 3–4 technical replicates of each, and so contain pooled standard deviations of the populations and standard errors of the quantification. (E) Quantification of acidified-alcohol-extractable pigment from white mottled-4 flies raised on SY10 and SY30. Error bars are standard deviation of three parallel biological replicates each containing heads from 20 individuals. All P-values (in (A), (D), and (E)) were calculated using Student’s t-test.
Fig 2
Fig 2. Copy number and RNA expression of R1 and R2 retrotransposable elements are not discordant.
(A) Reverse Transcriptase Real-time PCR of expression of R1 and R2 transcripts from flies raised on Standard, SY10, or SY30 food sources. Values are normalized to rho1 mRNA and relative to R1 and R2 RNA levels in flies raised on Standard food, errors indicate standard error of the mean and capture increases in pooled populations raised on different food sources. Expression levels do not differ significantly from each other (only P-values less than 0.25 are shown). (B) Copy number determination of R1 and R2 elements in the Y-linked rDNA loci of flies raised on SY10, raised on SY30, or a rDNA deletion allele from a previous study with I-CreI-mediated rDNA loss (bb-183). “R1” detects unique R1-rDNA junctions, while “noR1” detects the rDNA flanking the stereotyped R1 insertion site in the rDNA. “R2” and “noR2” similarly detect R2-inserted 35S rDNA and 35S without R2 insertion, respectively. Note that each reaction uses separate primers, so comparisons between primers (“R1,” “noR1,” “R2,” “noR2”) are not valid, while comparisons between treatments (SY10, SY30, bb-183) are.
Fig 3
Fig 3. Mutations affecting nutrient signaling perturb nucleolar stability.
(A) α-Fibrillarin immunofluorescent detection in salivary gland nuclei from wild-type larvae or (B) larvae expressing a hypermorphic insulin receptor allele (InR.R418P) under the control of Ubi-GAl4. (C) Flies expressing InR.R418P were raised on food tainted with 10 µM rapamycin did not exhibit multiple nucleoli. (D) Flies expressing an antimorphic insulin receptor allele (InR.K1409A) did not have multiple nucleoli. In all images, red shows fibrillarin and blue shows DNA. N = total number of nuclei scored, F = percentage of nuclei with multiple nucleoli.
Fig 4
Fig 4. Pharmacological insulin treatment acts acutely to destabilize nucleoli.
(A) Representative picture of a cultured salivary gland expressing a mRFP-Fibrillarin fusion gene and counterstained with DAPI. Pie chart shows percent of nuclei that had single nucleoli (white) or multiple nucleoli (black), and arrows indicate which population of nuclei images were taken from. N = total number of nuclei scored, F = percentage of nuclei with multiple nucleoli. (B) As in (A), but cultured with recombinant human insulin for 24 hours. (C) As in (B), but with a 2-hour treatment of Rapamycin prior to insulin addition. (D) As in (B), but with a treatment of Rapamycin during the last 2 hours of insulin exposure. (E) and (F) are as (C) and (D), respectively but treatment was with Actinomycin-D instead of Rapamycin.
Fig 5
Fig 5. Adult diet changes rDNA copy number of progeny.
(A) Crossing scheme used to genetically isolate Y-linked rDNA arrays for quantitative real-time PCR analysis. DNA was extracted from female progeny. C(1)DX has no rDNA (rDNA0), X and Y chromosomes initially have normal complements of rDNA (rDNA+), and effects of diet are assessed on the patroclinous Y-linked rNA (rDNA*) Numbers ((1) and (2)) are referred to in the main text. (B) Y-linked rDNA copy number of the progeny of males raised on SY10 or SY30 as larvae. Percentages calculated relative to the progeny of males raised on Standard (Std) food, defined as 100% (gray bar). N = 3 pools each of 20 larvae for each condition. (C) Crossing scheme used to treat and isolate Y-linked rDNA arrays for analysis. “Control” flies were derived from freshly-eclosed males mated to C(1)DX females and raised entirely on Standard food, and dietary-manipulated flies were derived from crosses of the same males after brooding on different food sources (see text, including references to (3)-(6)) then outcrossed to C(1)DX females and the progeny raised entirely on Standard food. (D) Y-linked rDNA copy number of progeny of adult males kept for 20 days on SY10, SY30, or Standard food with or without 10 μM Rapamycin. Percentages calculated relative to the progeny of males mated prior to the 20-day treatment (“Control” in (C)). Error bars are standard deviation of three independent biological replicates each of ten sibling females. P-values calculated using Student’s t-test.
Fig 6
Fig 6. rDNA deletions persist through multiple generations.
(A) Crossing scheme used to establish long-term rDNA deletion stocks and to isolate Y-rDNA arrays for real-time PCR analysis. Nomenclature is as in Fig 5. (B) Y-rDNA copy number of three independent lines (“Lines” 1–3) established from SY30-fed males. Y-rDNA was isolated and quantified two generations after dietary treatment. Percentages calculated relative to Y-rDNA isolated from F0 males (top line in (A)) prior to treatment. Y-rDNA copy number of an I-CreI induced rDNA deletion (“bb-183”) no fewer than sixty generations after it was established, and subsequently maintained on Standard media. Y-rDNA copy number of a mutation-induced rDNA deletion (“10Bt205”) approximately 25 generations after it was established, and subsequently maintained on Standard media. Percentage calculated relative to the control line from which the deletion stock was generated. DNA was isolated from pools of ten sibling females and error bars represent standard error of the mean of three technical replicates.

References

    1. Anway M.D., et al., Epigenetic transgenerational actions of endocrine disruptors and male fertility. Science, 2005. 308(5727): p. 1466–9. - PMC - PubMed
    1. Jirtle R.L. and Skinner M.K., Environmental epigenomics and disease susceptibility. Nat Rev Genet, 2007. 8(4): p. 253–62. - PMC - PubMed
    1. Arico J.K., et al., Epigenetic Patterns Maintained in Early Caenorhabditis elegans Embryos Can Be Established by Gene Activity in the Parental Germ Cells. PLoS Genet, 2011. 7(6): p. e1001391 10.1371/journal.pgen.1001391 - DOI - PMC - PubMed
    1. Feil R. and Fraga M.F., Epigenetics and the environment: emerging patterns and implications. Nat Rev Genet, 2011. 13(2): p. 97–109. 10.1038/nrg3142 - DOI - PubMed
    1. Greer E.L., et al., Transgenerational epigenetic inheritance of longevity in Caenorhabditis elegans. Nature, 2011. 479(7373): p. 365–71. 10.1038/nature10572 - DOI - PMC - PubMed

Publication types

MeSH terms

LinkOut - more resources