. 2015 Apr 9:15:242.
doi: 10.1186/s12885-015-1192-2.

DNA copy number analysis of metastatic urothelial carcinoma with comparison to primary tumors

Affiliations

DNA copy number analysis of metastatic urothelial carcinoma with comparison to primary tumors

Richard M Bambury et al. BMC Cancer. .

Abstract

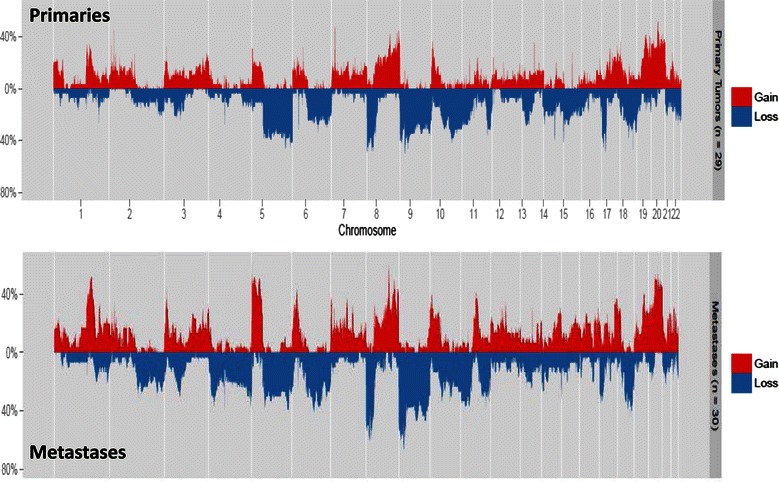
Background: To date, there have been no reports characterizing the genome-wide somatic DNA chromosomal copy-number alteration landscape in metastatic urothelial carcinoma. We sought to characterize the DNA copy-number profile in a cohort of metastatic samples and compare them to a cohort of primary urothelial carcinoma samples in order to identify changes that are associated with progression from primary to metastatic disease.

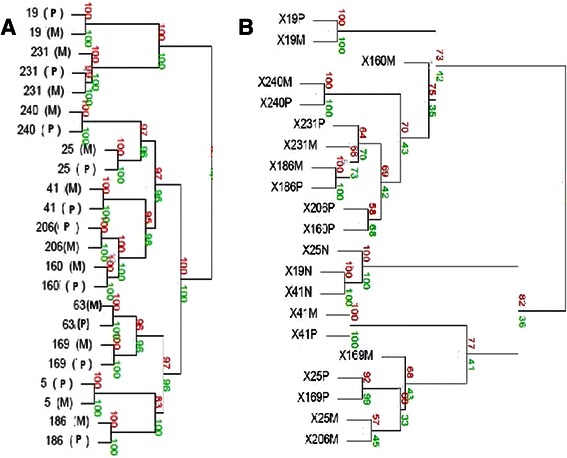
Methods: Using molecular inversion probe array analysis we compared genome-wide chromosomal copy-number alterations between 30 metastatic and 29 primary UC samples. Whole transcriptome RNA-Seq analysis was also performed in primary and matched metastatic samples which was available for 9 patients.

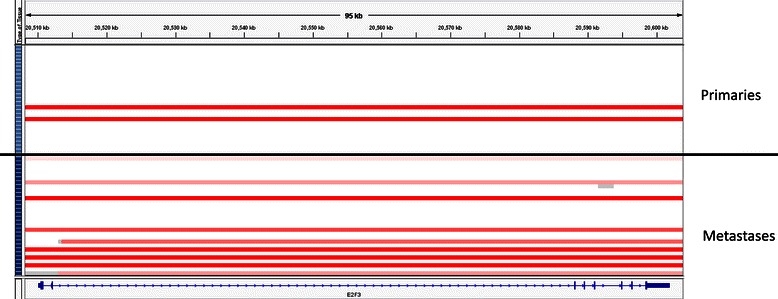
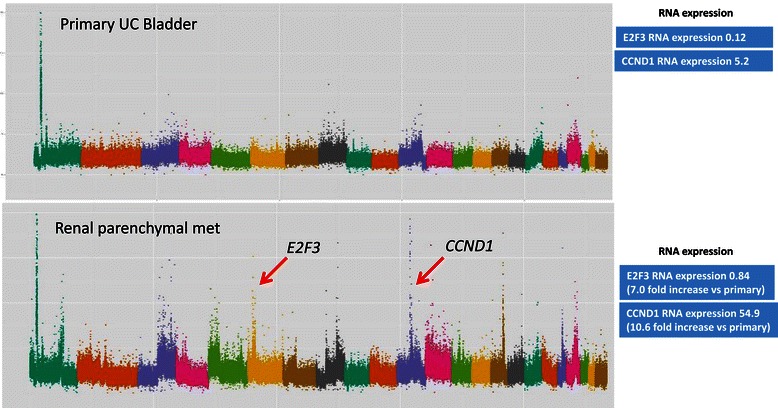
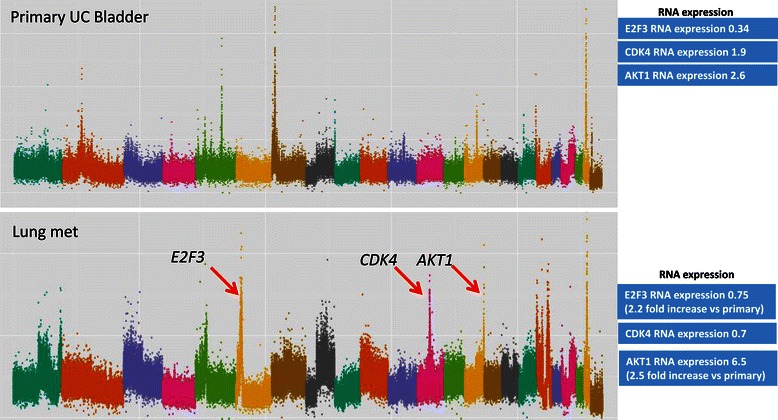
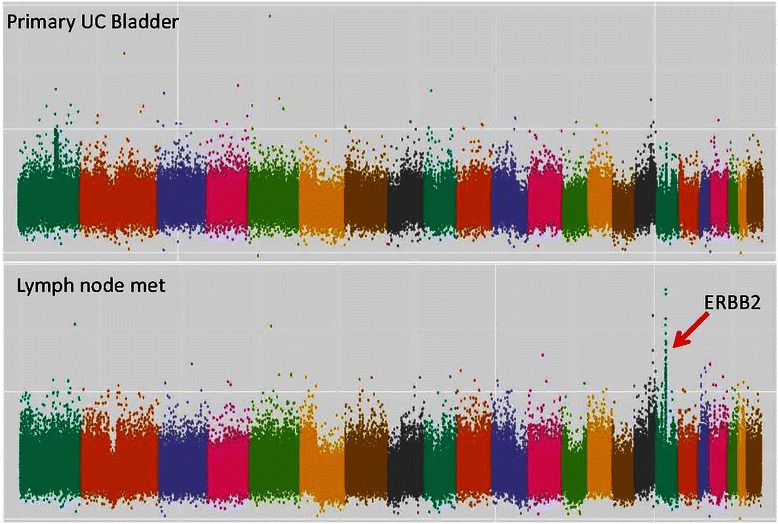
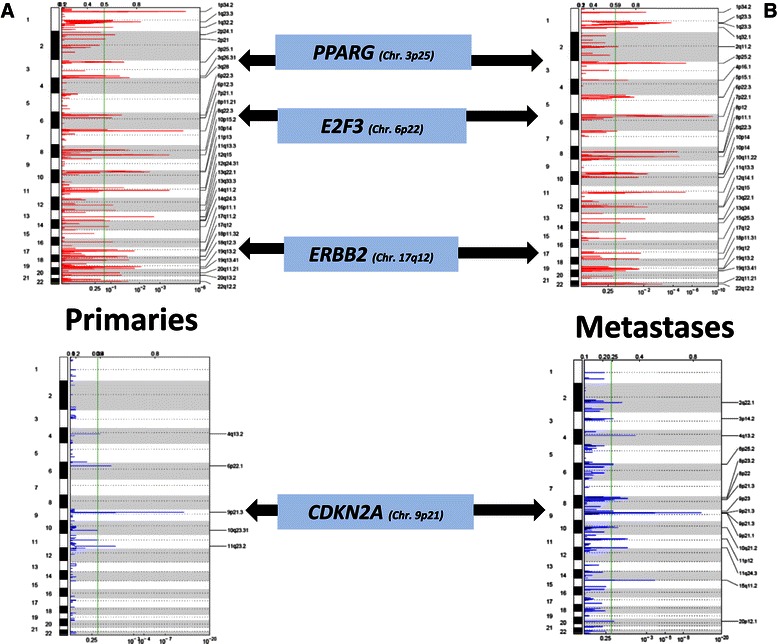
Results: Based on a focused analysis of 32 genes in which alterations may be clinically actionable, there were significantly more amplifications/deletions in metastases (8.6% vs 4.5%, p < 0.001). In particular, there was a higher frequency of E2F3 amplification in metastases (30% vs 7%, p = 0.046). Paired primary and metastatic tissue was available for 11 patients and 3 of these had amplifications of potential clinical relevance in metastases that were not in the primary tumor including ERBB2, CDK4, CCND1, E2F3, and AKT1. The transcriptional activity of these amplifications was supported by RNA expression data.

Conclusions: The discordance in alterations between primary and metastatic tissue may be of clinical relevance in the era of genomically directed precision cancer medicine.


Figures

Figure 1
Figure 1
E2F3amplification in primary tumors vs. metastases. Analysis of E2F3 gene copy number data using IGV with each row representing a single tumor sample. Primary tumor samples are arrayed above the black line and metastases below it. On the left side of the diagram, the light blue boxes represent primary tumor samples and the dark blue boxes represent metastases. Red bars represent amplification (log2 copy number ratio >0.8).
Figure 2
Figure 2
DNA copy number and RNA expression data from patient #25. Copy number plot with the x-axis denoting each point across the genome - each chromosome is highlighted in a different colour starting with chromosome 1 on the left side. Y-axis enumerates the log-2 copy number value at each point across the genome.Red arrows indicate gene amplifications highlighted in this manuscript and corresponding RNASeq expression readouts are displayed in blue boxes. Normal E2F3 copy number in primary tumour (log2 copy number ratio 0.10) and amplification of E2F3 in the metastasis (log2 copy number ratio 0.85). Normal CCND1 copy number in primary tumour (log2 copy number ratio 0.60) and amplification of CCND1 in the metastasis (log2 copy number ratio 3.29).
Figure 3
Figure 3
DNA copy number and RNA expression data from patient #160. Copy number plot with the x-axis denoting each point across the genome - each chromosome is highlighted in a different colour starting with chromosome 1 on the left side. Y-axis enumerates the log-2 copy number value at each point across the genome. Red arrows indicate gene amplifications highlighted in this manuscript and corresponding RNASeq expression readouts are displayed in blue boxes. Normal E2F3 copy number in primary tumour (log2 copy number ratio 0.07) and amplification of E2F3 in the metastasis (log2 copy number ratio 1.17). Normal CDK4 copy number in primary tumour (log2 copy number ratio 0.20) and amplification of CDK4 in the metastasis (log2 copy number ratio 1.53). Normal AKT1 copy number in primary tumour (log2 copy number ratio 0.16) and amplification of AKT1 in the metastasis (log2 copy number ratio 1.12).
Figure 4
Figure 4
DNA copy number data from patient #63. Copy number plot with the x-axis denoting each point across the genome - each chromosome is highlighted in a different colour starting with chromosome 1 on the left side. Y-axis enumerates the log-2 copy number value at each point across the genome. Red arrow indicates gene amplification highlighted in this manuscript. Normal ERRB2 copy number in primary tumour (log2 copy number ratio 0.34) and amplification of E2F3 in the metastasis (log2 copy number ratio 1.19).
Figure 5
Figure 5
Low amplitude copy number alterations in primary vs metastatic tumors. Copy number frequency plots displaying the frequency of copy number gain (CNG) and copy number loss (CNL) at different points across the genome using a cut-off log2 ratio +/− 0.25 for CNG and CNL, respectively. The x axis represents the different chromosomes and the y-axis quantifies the percentage of samples with copy number loss or gain greater than the +/− 0.25 log2 ratio cut-off.
Figure 6
Figure 6
GISTIC 2.0 analysis of primary (a) and metastatic (b) cohorts. Copy number data was analysed using GISTIC 2.0 as described in the methods section. The y-axis represents the chromosomal location and the x-axis quantifies the q-value at that point in the genome. The green line denotes cut-off q-value of 0.25 which was used to determine significant events. Red peaks refer to amplifications and blue peaks to deletions.
Figure 7
Figure 7
Hierarchical clustering analysis. Hierarchical clustering analysis using both DNA (a) and RNA (b) datasets. The bootstrapping procedure estimates how strongly the clusters are supported by data. Bootstrap values are estimated using multi-scale bootstrap resampling (shown in red numbers) and normal resampling (shown in green numbers), and are reported as percentages, indicating how often a cluster was observed in the bootstrapping [34]. P = primary tumor, M = metastasis, N-normal tissue. For the RNA clustering plot, P = primary tumor, M = metastasis, N = normal tissue. Note: for patient 231 two separate brain metastases were analyzed and both clustered together as shown.

References

    1. Jemal A, Bray F, Center MM, Ferlay J, Ward E, Forman D. Global cancer statistics. CA Cancer J Clin. 2011;61(2):69–90. doi: 10.3322/caac.20107. - DOI - PubMed
    1. Eble JN, World Health Organization Classification of Tumours. Sauter G, Epstein JI, Sesterhenn IA. Pathology and Genetics of Tumours of the Urinary System and Male Genital Organs. Lyon, France: IARC Press; 2004.
    1. The Cancer Genome Atlas Research N Comprehensive molecular characterization of urothelial bladder carcinoma. Nature. 2014;507(7492):315–22. doi: 10.1038/nature12965. - DOI - PMC - PubMed
    1. Kompier LC, Lurkin I, van der Aa MN, van Rhijn BW, van der Kwast TH, Zwarthoff EC. FGFR3, HRAS, KRAS, NRAS and PIK3CA mutations in bladder cancer and their potential as biomarkers for surveillance and therapy. PLoS One. 2010;5(11):e13821. doi: 10.1371/journal.pone.0013821. - DOI - PMC - PubMed
    1. Iyer G, Al-Ahmadie H, Schultz N, Hanrahan AJ, Ostrovnaya I, Balar AV, et al. Prevalence and Co-occurrence of actionable genomic alterations in high-grade bladder cancer. J Clin Oncol Off J Am Soc Clin Oncol. 2013;31(25):3133–40. doi: 10.1200/JCO.2012.46.5740. - DOI - PMC - PubMed

Substances