. 2015 Jun;15(6):703-10.
doi: 10.1016/S1473-3099(15)70139-8. Epub 2015 Apr 14.

Statistical power and validity of Ebola vaccine trials in Sierra Leone: a simulation study of trial design and analysis

Affiliations

Statistical power and validity of Ebola vaccine trials in Sierra Leone: a simulation study of trial design and analysis

Steven E Bellan et al. Lancet Infect Dis. 2015 Jun.

Abstract

Background: Safe and effective vaccines could help to end the ongoing Ebola virus disease epidemic in parts of west Africa, and mitigate future outbreaks of the virus. We assess the statistical validity and power of randomised controlled trial (RCT) and stepped-wedge cluster trial (SWCT) designs in Sierra Leone, where the incidence of Ebola virus disease is spatiotemporally heterogeneous, and is decreasing rapidly.

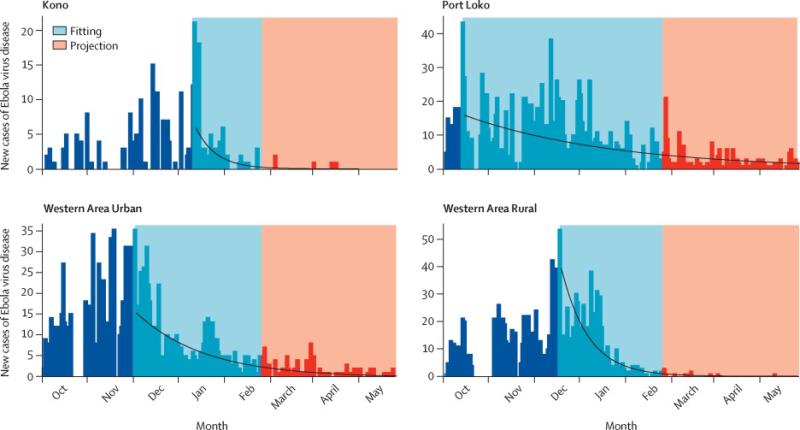
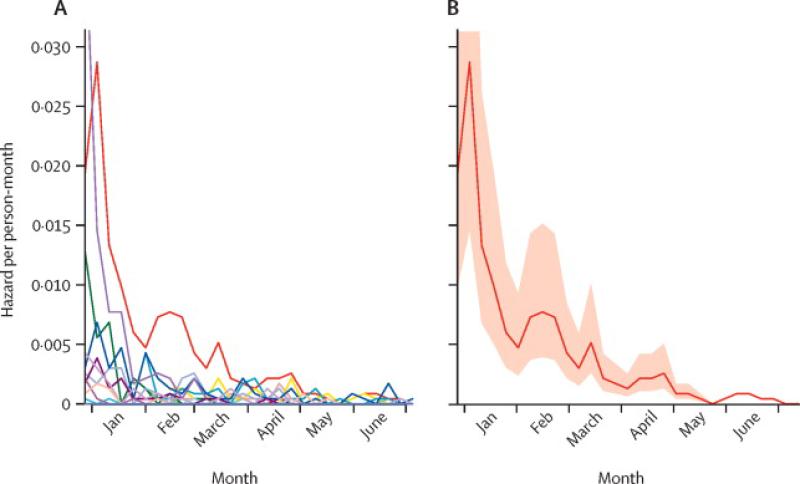
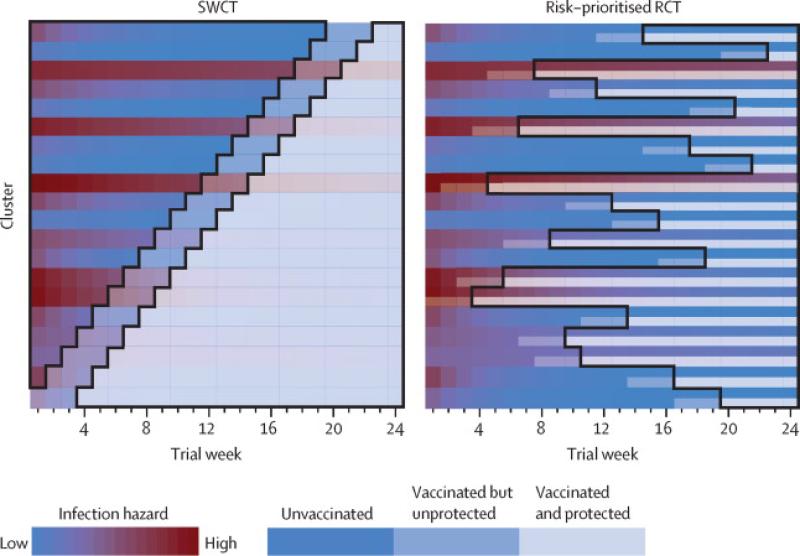
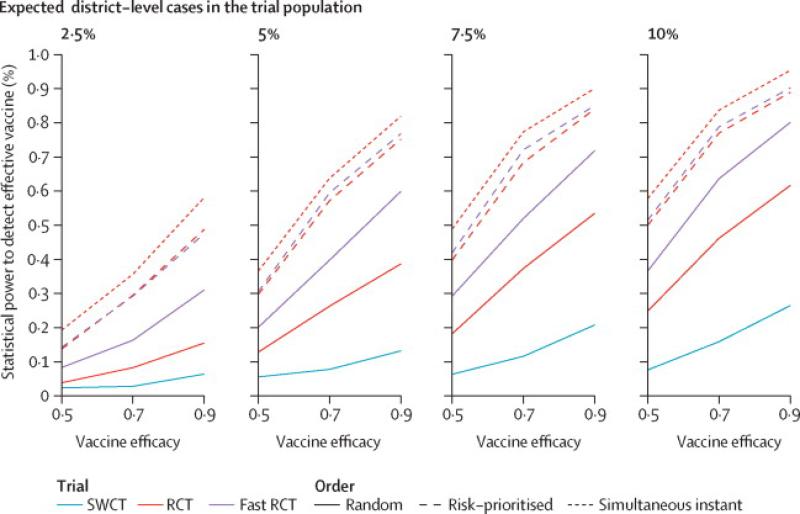
Methods: We projected district-level Ebola virus disease incidence for the next 6 months, using a stochastic model fitted to data from Sierra Leone. We then simulated RCT and SWCT designs in trial populations comprising geographically distinct clusters at high risk, taking into account realistic logistical constraints, and both individual-level and cluster-level variations in risk. We assessed false-positive rates and power for parametric and non-parametric analyses of simulated trial data, across a range of vaccine efficacies and trial start dates.

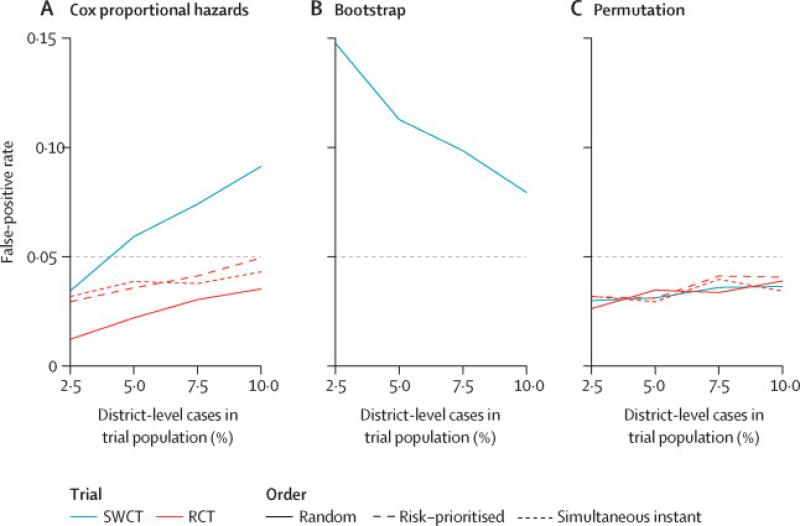
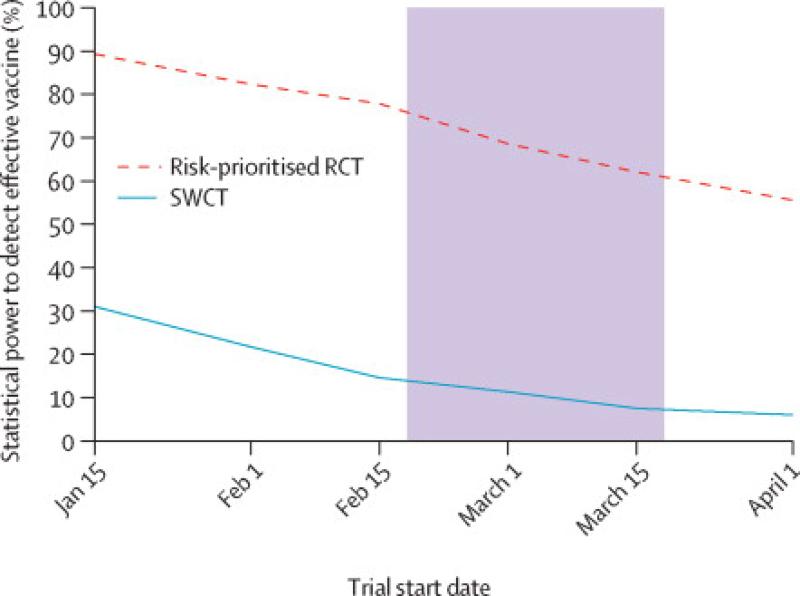
Findings: For an SWCT, regional variation in Ebola virus disease incidence trends produced increased false-positive rates (up to 0·15 at α=0·05) under standard statistical models, but not when analysed by a permutation test, whereas analyses of RCTs remained statistically valid under all models. With the assumption of a 6-month trial starting on Feb 18, 2015, we estimate the power to detect a 90% effective vaccine to be between 49% and 89% for an RCT, and between 6% and 26% for an SWCT, depending on the Ebola virus disease incidence within the trial population. We estimate that a 1-month delay in trial initiation will reduce the power of the RCT by 20% and that of the SWCT by 49%.

Interpretation: Spatiotemporal variation in infection risk undermines the statistical power of the SWCT. This variation also undercuts the SWCT's expected ethical advantages over the RCT, because an RCT, but not an SWCT, can prioritise vaccination of high-risk clusters.

Funding: US National Institutes of Health, US National Science Foundation, and Canadian Institutes of Health Research.


Figures

Figure 1
Figure 1. Fitted incidence projection models
Exponential decay functions (blue) fit to EVD incidence (black) within four Sierra Leone districts, with example stochastic incidence projections (red). The models were fit to district-level incidence data from the local peak until February 9, 2015 with negative binomial distributions. We estimated an average negative binomial overdispersion parameter of 1.2 across districts and used this estimate in projections.
Figure 2
Figure 2. Ebola risk projections in simulated trial populations
(A) Cluster-level projections. An example of simulated weekly Ebola infection hazards for 20 clusters based on district-level forecasts from Sierra Leone under the assumption that, in the absence of vaccination, 5% of district-level cases would occur in trial clusters within each district. (B) Individual-level variation. Mean and interquartile range of infection risk across individuals in one example cluster.
Figure 3
Figure 3. Schematic diagram of trial designs
A diagrammatic representation of the stepped wedge cluster trial (SWCT) and the risk-prioritized randomized controlled trial (RCT) on the same trial population, assuming that only one cluster can receive vaccination per week. Each row corresponds to a single cluster over the 24 weeks of the trial, with color indicating the level of infection risk within the cluster (ranging from red to blue for high to low risk) and transparency indicating vaccination status (opaque, intermediate and transparent corresponding to unvaccinated, vaccinated but not yet protected, and vaccinated and protected, respectively). Areas outlined in black indicate the person-time at risk analyzed in either design, with both analyses excluding the 21-day delay between vaccination and protection. In the SWCT, entire clusters are vaccinated in random order to allow unbiased comparison between vaccinated and not-yet-vaccinated clusters. In the RCT, half of the individuals in each cluster are chosen at random to be vaccinated, and cluster order can be nonrandom. Here, we assume that clusters are prioritized in order of recently estimated risk (the reddest cluster two weeks preceding each round of vaccination). When risk varies both in time and across clusters, the RCT allows more direct and sustained comparison of vaccinated and unvaccinated individuals in similar high-risk settings. The RCT also maintains a balanced ratio of person-time in vaccinated and control arms, in contrast to the SWCT, in which this ratio changes throughout the trial. For these reasons and because of the greater power achieved by individual randomization, the risk-prioritized RCT achieves greater statistical power to detect vaccine efficacy. For diagrams of the random-ordered and simultaneous instant RCT and the FRCT in the same trial population and alternative analyses of the SWCT, see Figures S1-S2.
Figure 4
Figure 4. False positive rates by trial design and analysis
False positive rates shown by trial design, analytical method, proportion of district-level cases occurring among trial participants, and order of cluster vaccination (for RCT). Elevation above the target false positive rate of 0.05 (horizontal gray line) indicates an invalid study for SWCT when analyzed with a Cox proportional hazards frailty model (A) or with cluster-level bootstrap confidence intervals (B), while all analyses of RCTs or of an SWCT with a permutation test (C) maintain pre-specified false positive rates. Line types indicate whether RCT clusters are vaccinated in random order (random), in order of highest risk (risk-prioritized), or all simultaneously at the start of the trial (simultaneous instant). Underlying hazards are based on district-level incidence forecasts (Figure 2). We did not apply cluster-level bootstrapping to the RCT designs because they rely on individual-level randomization. FRCT results are not shown here but were qualitatively similar to those of the RCT.The simultaneous instant design is a hypothetical idealized design and is presented here for comparative purposes but is not considered a feasible trial design in this context.
Figure 5
Figure 5. Statistical power by trial design and expected hazard to trial participants
Panels differ by proportion of district-level cases occurring among trial participants in the absence of vaccination. Line types indicate whether RCT clusters are vaccinated in random order (random), in order of highest risk (risk-prioritized), or all simultaneously at the start of the trial (simultaneous instant). RCT/FRCT data are analyzed with a Cox proportional hazards frailty model; SWCT data are analyzed with a permutation test over estimates from the Cox proportional hazards frailty model. The simultaneous instant design is a hypothetical idealized design and is presented here for comparative purposes but is not considered a feasible trial design in this context.
Figure 6
Figure 6. Statistical power by trial design and start date
Estimated power by trial start date, assuming that, in the absence of vaccination, 5% of district-level cases occur in the trial, the candidate vaccine is 90% efficacious, and the vaccine protective delay is 21 days. The shaded area highlights the effect of a one-month delay in the start date.

Comment in

  • Ebola vaccine trials: a race against the clock.
    Chowell G, Viboud C. Chowell G, et al. Lancet Infect Dis. 2015 Jun;15(6):624-6. doi: 10.1016/S1473-3099(15)70159-3. Epub 2015 Apr 14. Lancet Infect Dis. 2015. PMID: 25886800 No abstract available.

References

    1. Mohammadi D. Ebola vaccine trials back on track. Lancet. 2015;385:214–5. - PubMed
    1. Centers for Disease Control and Prevention . ClinicalTrials.gov [Internet] National Library of Medicine (US); Bethesda (MD): 2015. STRIVE (Sierra Leone Trial to Introduce a Vaccine Against Ebola). Available from https://clinicaltrials.gov/ct2/show/NCT02378753 NLM Identifier: NCT02378753.
    1. Enserink M. High hopes for Guinean vaccine trial. Science (80-) 2015;347:219–20. - PubMed
    1. Van der Graaf R, van Delden JJM. Equipoise should be amended, not abandoned. Clin Trials. 2011;8:408–16. - PubMed
    1. Adebamowo C, Bah-Sow O, Binka F, et al. Randomised controlled trials for Ebola: practical and ethical issues. Lancet. 2014;384:1423–4. - PMC - PubMed

Publication types

MeSH terms