. 2015 Mar 7;16(1):155.
doi: 10.1186/s12864-015-1310-1.

Development and preliminary evaluation of a 90 K Axiom® SNP array for the allo-octoploid cultivated strawberry Fragaria × ananassa

Affiliations

Development and preliminary evaluation of a 90 K Axiom® SNP array for the allo-octoploid cultivated strawberry Fragaria × ananassa

Nahla V Bassil et al. BMC Genomics. .

Abstract

Background: A high-throughput genotyping platform is needed to enable marker-assisted breeding in the allo-octoploid cultivated strawberry Fragaria × ananassa. Short-read sequences from one diploid and 19 octoploid accessions were aligned to the diploid Fragaria vesca 'Hawaii 4' reference genome to identify single nucleotide polymorphisms (SNPs) and indels for incorporation into a 90 K Affymetrix® Axiom® array. We report the development and preliminary evaluation of this array.

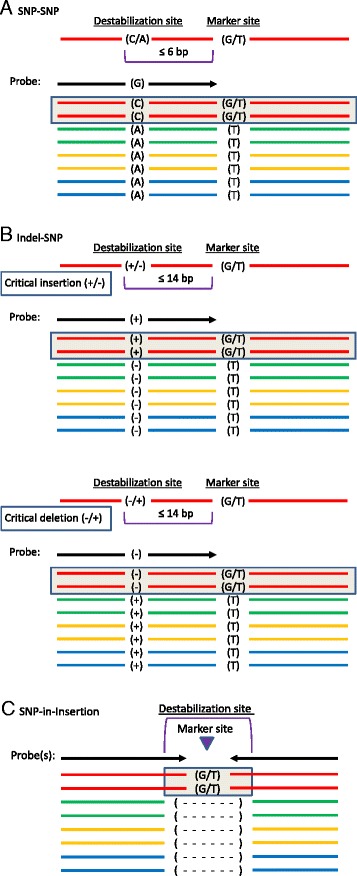
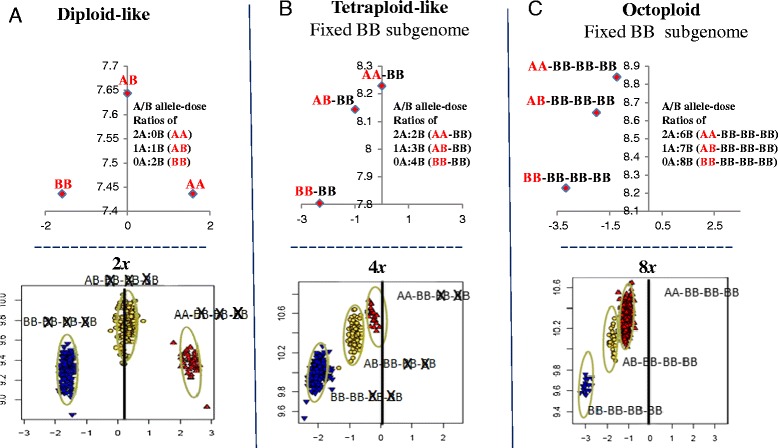
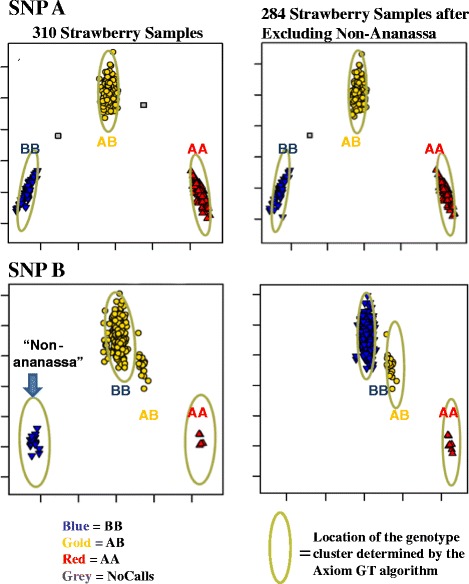
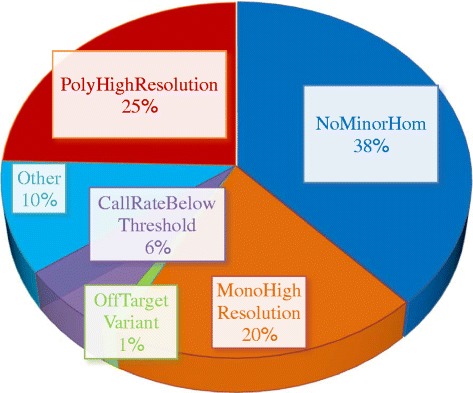
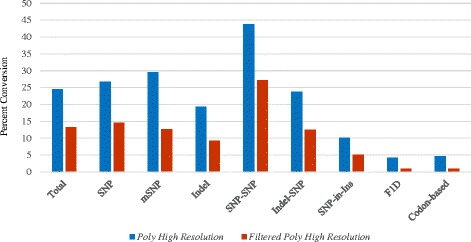
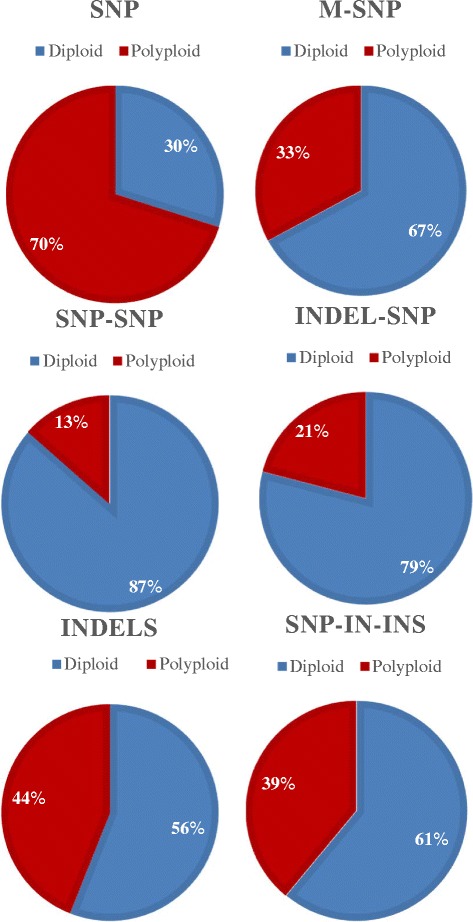
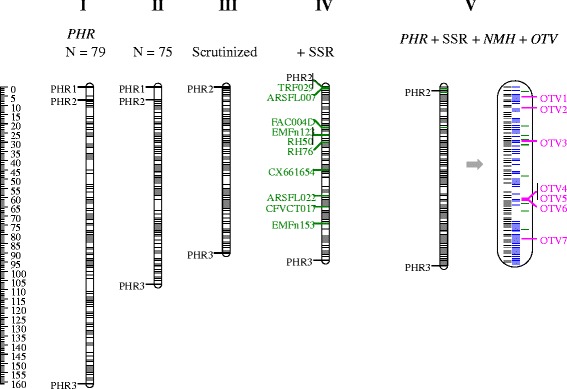
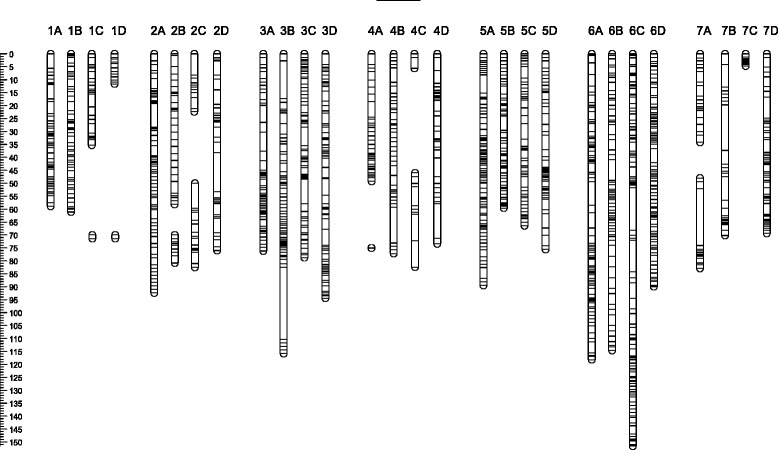
Results: About 36 million sequence variants were identified in a 19 member, octoploid germplasm panel. Strategies and filtering pipelines were developed to identify and incorporate markers of several types: di-allelic SNPs (66.6%), multi-allelic SNPs (1.8%), indels (10.1%), and ploidy-reducing "haploSNPs" (11.7%). The remaining SNPs included those discovered in the diploid progenitor F. iinumae (3.9%), and speculative "codon-based" SNPs (5.9%). In genotyping 306 octoploid accessions, SNPs were assigned to six classes with Affymetrix's "SNPolisher" R package. The highest quality classes, PolyHigh Resolution (PHR), No Minor Homozygote (NMH), and Off-Target Variant (OTV) comprised 25%, 38%, and 1% of array markers, respectively. These markers were suitable for genetic studies as demonstrated in the full-sib family 'Holiday' × 'Korona' with the generation of a genetic linkage map consisting of 6,594 PHR SNPs evenly distributed across 28 chromosomes with an average density of approximately one marker per 0.5 cM, thus exceeding our goal of one marker per cM.

Conclusions: The Affymetrix IStraw90 Axiom array is the first high-throughput genotyping platform for cultivated strawberry and is commercially available to the worldwide scientific community. The array's high success rate is likely driven by the presence of naturally occurring variation in ploidy level within the nominally octoploid genome, and by effectiveness of the employed array design and ploidy-reducing strategies. This array enables genetic analyses including generation of high-density linkage maps, identification of quantitative trait loci for economically important traits, and genome-wide association studies, thus providing a basis for marker-assisted breeding in this high value crop.


Figures

Figure 1
Figure 1
Allelic configurations of SNP (di-allelic and multi-allelic) and indel markers in an octoploid. Panel A) Di-allelic SNPs: To qualify as di-allelic, only two alleles can be detected at the site. The “marker allele” is present only in one subgenome (the marker subgenome), within which it can be homozygous present, heterozygous, or homozygous absent. In case 1 a single probe can be used to interrogate the marker because the indicated polymorphism is neither A/T nor G/C. In case 2 two probes must be used because the indicated polymorphism is an A/T (also true for a G/C polymorphism). Panels B and C) Multi-allelic SNPs: More than two alleles are represented at the site. Three distinctive cases are shown for tri-allelic (Panel B) and for tetra-allelic sites (Panel C). In tri-allelic case 1 the marker polymorphism is G/T, while there is a C at the same site in the background subgenomes. Genotyping of this marker would require two probes. In case 2 the marker polymorphism is G/T, with a background G in one subgenome and a background C in the others. Genotyping of this marker would require two probes. In case 3 there are two marker polymorphisms, a G/T in one subgenome and a G/C in another, while there is a C at the site in the background subgenomes. Three probes and a non-standard analysis algorithm are needed for this polymorphism. Genotyping of case 3 tri-allelic markers, and of tetra-allelic markers (Panel C) is currently not possible. Panel D) Di-allelic indels: Only two alleles are represented at the site. Although they are genomic insertions and deletions, the indel polymorphisms are genotyped as SNPs, and various probing strategies may be employed depending upon the sequence characteristics within and immediately adjacent to the indel.
Figure 2
Figure 2
Representation of the three haploSNP categories consisting of SNP-SNP (A), Indel-SNP (B), and SNP-in-Insertion (C). A) In the SNP-SNP (A) and indel-SNP (B) strategies the “critical form” of the destabilizing site, to which the probe is targeted, must be coupled to the SNP marker allele. Due to its asymmetric nature, a SNP-SNP or indel-SNP site can be probed only on one strand. A single probe is employed if the marker polymorphism is not A/T or G/C, while two probes are required if it is A/T or G/C. In the SNP-SNP strategy, the destabilizing SNP site must be present within 6 bp of the marker SNP site, while in the indel-SNP strategy, the destabilizing indel site must be present within 14 bp of the marker SNP site. In relation to the background alleles, the critical form of an indel destabilization site (B) can be either an insertion or a deletion. In the SNP-in-Insertion (C) strategy, the probe is expected to anneal only to the insertional form of an indel, and to interrogate a SNP polymorphism that resides within the insertion in one subgenome. A SNP-in-Insertion site can be probed on either or both strands.
Figure 3
Figure 3
Six SNP quality classes (A) and four variance filters (B) applied to the PHR genotype class. A. Default SNP quality classes produced by the Axiom Best Practices Genotyping Workflow. B. An example cluster plot for a SNP identified with each of the four variance filters used including: AB.varY identified large heterozygous cluster variance in the Y dimension; AA.varY for homozygous (AA) variance in the Y dimension; BB.varY, for homozygous (BB) variance in the Y dimension; and AB.varX, for heterozygous variance in the X dimension.
Figure 4
Figure 4
Apparent polyploid levels based on comparing simulated to observed cluster locations. Points for plots in upper row are the simulated cluster center locations for the given genotype where A = (#A_alleles * Intensity_per_A_allele) + Background_Intensity and B = (#B_alleles * Intensity_per_B_allele) + Background_Intensity. Intensity_per_A_allele = Intensity_per_B_allele = Background_Intensity = 100. The #A_alleles and #B_alleles are the counts of each allele in the given genotype. Points for plots in lower row are the observed contrast vs size values for each sample. Each column in 4A, 4B, and 4C is a SNP locus at a different polyploid level. An “X” is drawn over subgenome genotypes to indicate effective absence. A vertical bar is drawn at contrast = zero. A: The 2x/diploid-like cluster pattern. Alleles segregate in one subgenome and are effectively absent in the other three subgenomes. The AB cluster is centered ~ contrast = zero and the homozygous BB and AA genotype clusters have negative and positive contrast values, respectively, in the simulated and observed cluster patterns. B: The 4x/allo-tetraploid-like cluster pattern. Alleles segregate in one subgenome, are fixed in another subgenome, and are effectively absent in the other two subgenomes. One of the genotype clusters AABB, is centered near contrast = zero and the other two genotype clusters are offset to negative contrast values in both the simulated and observed cluster patterns, and correspond to one subgenome being fixed for the B-allele. C: The 8x/allo-octoploid-like pattern. Alleles segregate in one subgenome, and are fixed in at least two other subgenomes. Simulation is shown for allo-octoploid genotypes, where alleles segregate in one subgenome and three other subgenomes are present and fixed for the same allele. The pattern is the same as that for the 4x locus, except that all genotype clusters are offset to the positive (subgenomes are fixed for the A-allele) or negative (subgenomes are fixed for the B-allele, shown) contrast values.
Figure 5
Figure 5
Effect of excluding 51 “non-ananassa” octoploid accessions from genotyping co-cluster runs for two SNPs. The cluster plots in the left column are for 310 strawberry samples. The cluster plots in the right column are for 284 strawberry samples, excluding the non-ananassa samples (F. chiloensis and F. virginiana). SNP A is a robust diploid-like SNP site that produces only three genotype clusters in the presence as well in the absence of the wild progenitor samples, and thus is genotyped correctly in both circumstances. SNP B is a more challenging SNP site at which the genomes of the divergent non-ananassa form a 4th genotype cluster (arrow). This 4th cluster causes the samples in the BB homozygous genotype cluster to be incorrectly called as heterozygous (colored gold). When the non-ananassa samples are excluded (bottom right), the software correctly calls the samples in the homozygous BB cluster as “BB” (colored blue).
Figure 6
Figure 6
Proportion of 90K array markers classified into each of the six classes by “SNPolisher”.
Figure 7
Figure 7
Conversion rate of each SNP category into the PHR and filtered PHR class of markers. SNP categories consisted of: standard di-allelic SNPs; multi-allelic SNPs (mSNPs); indels; reduced ploidy haploSNPs, including SNP-SNP, Indel-SNP, and SNP-in-Insertion (SNP-in-Ins); F. iinumae F1D SNPs; and speculative codon-based SNPs.
Figure 8
Figure 8
Proportion of diploid- and polyploid-clustering SNPs in the SNP categories designed from the octoploid GDP. Marker categories include di-allelic SNPs, multi-allelic SNPs (mSNPs), indels, and the three haploSNP categories of SNP-SNP, Indel-SNP, and SNP-in-Insertion.
Figure 9
Figure 9
Relationship of diploid clustering to mean genic read depth in F. × ananassa ‘Winter Dawn’, displayed for PHR di-allelic SNPs (A) and for PHR SNP-SNPs (B). Black dot positions, which are identical in panels A and B, represent the mean read depth category (X axis), and the relative frequency of this read depth category (Y axis). The size of each dot is directly proportional to the fraction of di-allelic SNP (A) or SNP-SNP (B) markers that displayed diploid-like clustering. For example, the green arrow in (A) points to a large black dot with mean read depth category of approximately 28× (X axis) and a category frequency of approximately 0.01 (Y axis). The red arrow in (A) points to a small black dot corresponding to a mean read depth category of about 100× and a category frequency of about 0.015. The larger dot sizes (green arrows) occur in (A) in regions of comparatively low read depth, and in (B) in regions of comparatively high read depth. Conversely, smaller dot sizes occur in (A) in regions of comparatively high read depth, and in (B) in regions of comparatively low read depth (red arrows).
Figure 10
Figure 10
Five SNP linkage maps for linkage group 6D. Maps were derived from successive steps in map construction: I) 413 PHR SNPs on the full family (n = 79); II) using 75 progeny (four individuals removed due to poor performance based on graphical genotyping results or because they were duplicates; III) after scrutinizing genotype calls, some data points were replaced with missing values thus removing singletons and a pair; IV) adding 10 previously mapped SSR loci [38]; and V) a full data set totaling 10 SSRs and 667 SNPs consisting of 413 PHR, 247 NMH and 7 OTV SNPs. Black, blue and pink locus lines indicate PHR, NMH and OTV SNPs respectively, and green lines indicate SSR loci. The outer PHR SNPs of the maps are highlighted. PHR markers 1 to 3 refer to AX-89840764, AX-89799050 and AX-89799050 respectively. OTV markers 1 to 7 refer to the SNP (of the cross) AX-89814809 (∅∅ × A∅), AX-89869370 (∅∅ × A∅), AX-89866711 (A∅ × ∅∅), AX-89871559 (A∅ × ∅∅), AX-89896961 (AB × BB), AX-89897092 (AB × BB), and AX-89808404 (A∅ × B∅), respectively.
Figure 11
Figure 11
Integrated PHR -SNP linkage map of allo-octoploid strawberry using the ‘Holiday’ × ‘Korona’ family (n = 75). A total of 6,593 markers were placed on this map. Linkage groups are named according to Van Dijk et al. [38]. Large gaps mostly coincide with homozygous regions as revealed by SSR-haplotype profiles [38]).
Figure 12
Figure 12
Relationship between the genetic map of LG6D of the allo-octoploid cultivar Holiday and that of the diploid cultivar F. vesca ‘Hawaii 4’. Panels A and B present SNPs and SSRs that physically came from LG6 or other LGs, respectively. The rulers indicate genetic distances in cM and physical distances in bases/ 403,743 (thus unifying scales). Different colours highlight cases of large discrepancies (Panel A), or indicate different physical LGs (Panel B). Panel A: Red & blue, proximal markers becoming distal and vice versa; Green, medium shift in position; Pink and orange, opposite order of multiple SNPs for a small and large chromosomal segment respectively.
Figure 13
Figure 13
Matching and non-matching HD-20 genotypes obtained by comparing sequence-derived to array-obtained genotypes. Genotype data was not available for HolKor 2557 as the genotype calls were < 97%. No genotype comparison was possible when read depth at the variant site was less than 20 (green bars).
Figure 14
Figure 14
Distribution of minor allele frequency (MAF ≥ 0.1 in green, ≥ 0.35 in blue) of SNPs across seven LGs. MAF is shown according to physical location on the F. vesca ‘Hawaii 4’ v1.0 reference genome in 65 diverse strawberry accessions.
Figure 15
Figure 15
Genomic basis for biologically effective ploidy reduction. A. Site-specific ploidy reduction in one or more subgenomes is a proportional consequence of site-specific deletion within the alternate subgenomes. Site-specific ploidy may be reduced from the octoploid (8x) to the hexaploid (6x), tetraploid (4x), or diploid (2x) levels. B. Alignment of Illumina short reads to the ‘Hawaii 4’ v1.1 reference genome reveals a ~1.5 kb region of localized read depth reduction, indicative of ploidy reduction, in octoploid F. ×ananassa ‘Winter Dawn’, corresponding to the site of a ~1.5 kb deletion in diploid F. iinumae relative to the F. vesca diploid reference genome. The deletion is absent in diploid F. mandshurica, a close relative of F. vesca. Visualized in Integrated Genome Viewer (IGV, Broad Institute).

References

    1. Iezzoni A, Weebadde C, Luby J, Chengyan Y, van de Weg E, Fazio G, et al. RosBREED: Enabling marker-assisted breeding in Rosaceae. Acta Horticult. 2010;859:389–94.
    1. Verde I, Bassil N, Scalabrin S, Gilmore B, Lawley CT, Gasic K, et al. Development and evaluation of a 9K SNP array for peach by internationally coordinated SNP detection and validation in breeding germplasm. PLoS ONE. 2012;7(4):e35668. doi: 10.1371/journal.pone.0035668. - DOI - PMC - PubMed
    1. Chagne D, Crowhurst RN, Troggio M, Davey MW, Gilmore B, Lawley C, et al. Genome-wide SNP detection, validation, and development of an 8K SNP array for apple. PLoS ONE. 2012;7(2):e31745. doi: 10.1371/journal.pone.0031745. - DOI - PMC - PubMed
    1. Montanari S, Saeed M, Knäbel M, Kim Y, Troggio M, Malnoy M, et al. Identification of Pyrus single nucleotide polymorphisms (SNPs) and evaluation for genetic mapping in european pear and interspecific Pyrus hybrids. PLoS ONE. 2013;8(10):e77022. doi: 10.1371/journal.pone.0077022. - DOI - PMC - PubMed
    1. Peace C, Bassil N, Main D, Ficklin S, Rosyara UR, Stegmeir T, et al. Development and evaluation of a genome-wide 6K SNP array for diploid sweet cherry and tetraploid sour cherry. PLoS ONE. 2012;7(12):e48305. doi: 10.1371/journal.pone.0048305. - DOI - PMC - PubMed

Publication types