. 2015 Jun;25(6):802-13.
doi: 10.1101/gr.184325.114. Epub 2015 Apr 17.

The clustering of functionally related genes contributes to CNV-mediated disease

Affiliations

The clustering of functionally related genes contributes to CNV-mediated disease

Tallulah Andrews et al. Genome Res. 2015 Jun.

Abstract

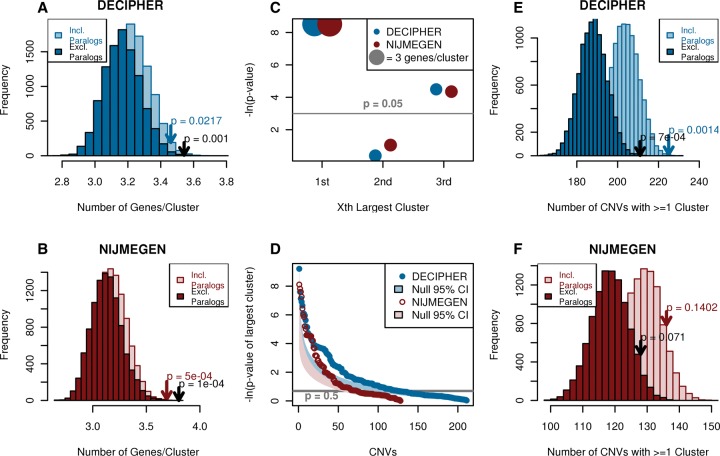
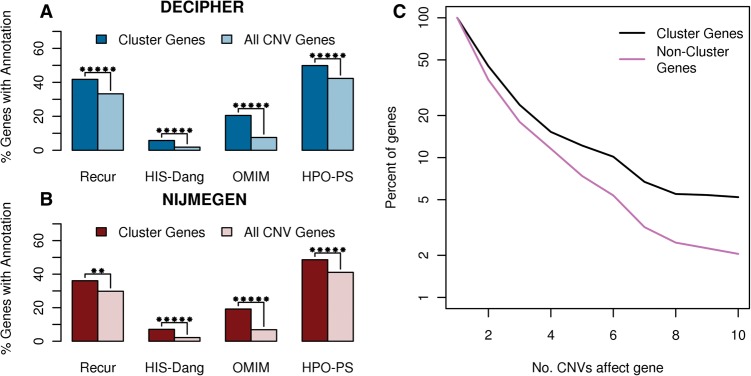
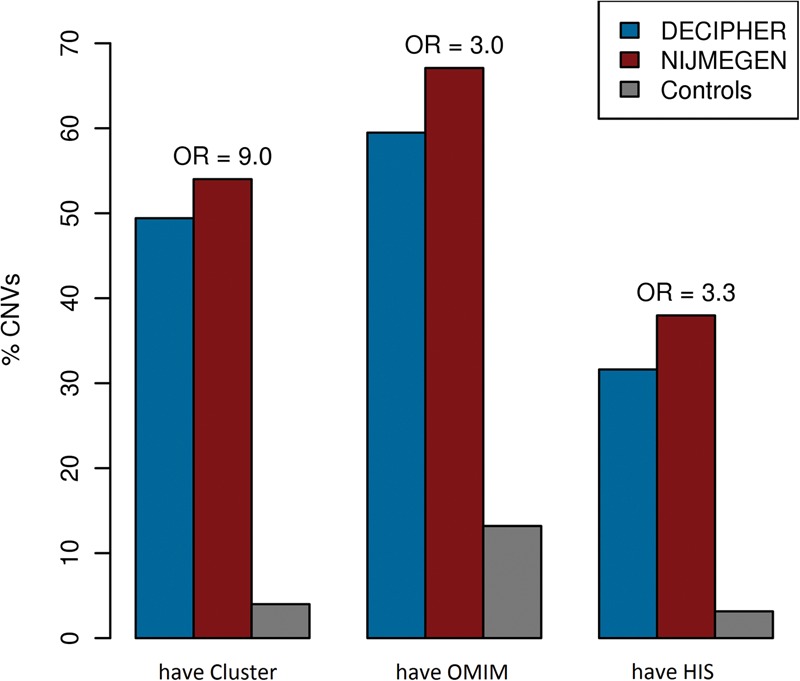
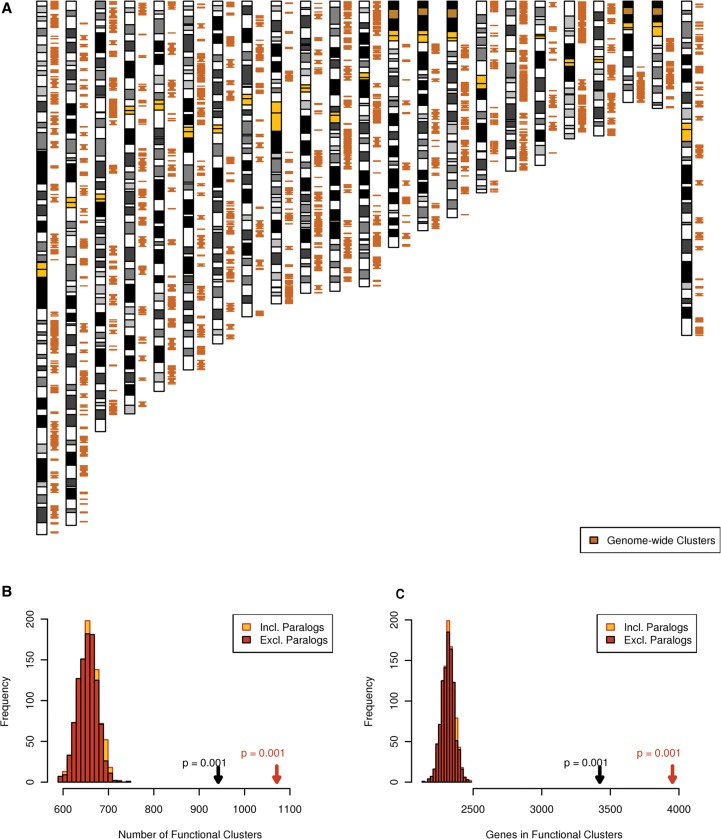
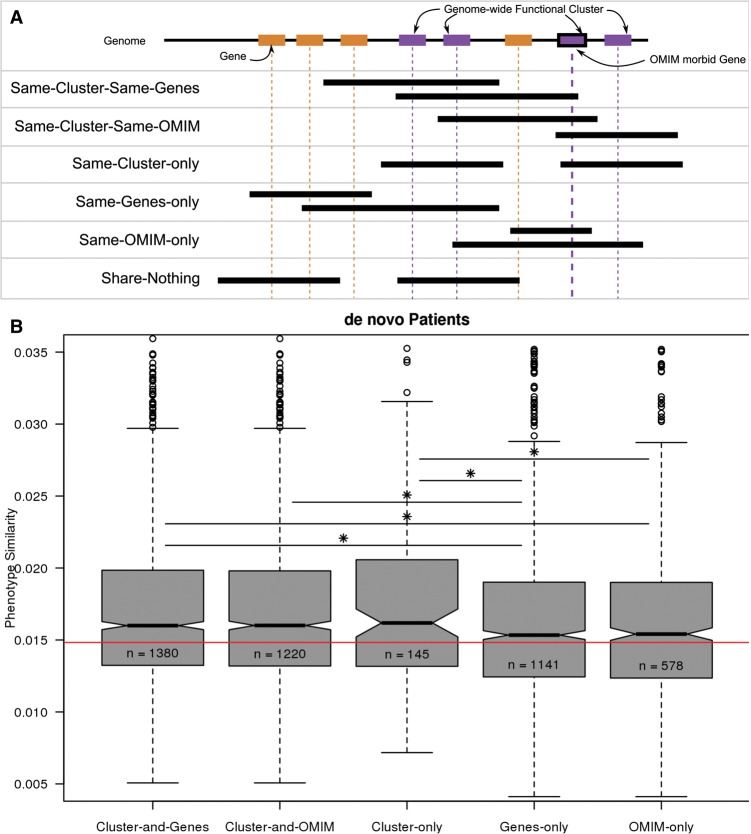
Clusters of functionally related genes can be disrupted by a single copy number variant (CNV). We demonstrate that the simultaneous disruption of multiple functionally related genes is a frequent and significant characteristic of de novo CNVs in patients with developmental disorders (P = 1 × 10(-3)). Using three different functional networks, we identified unexpectedly large numbers of functionally related genes within de novo CNVs from two large independent cohorts of individuals with developmental disorders. The presence of multiple functionally related genes was a significant predictor of a CNV's pathogenicity when compared to CNVs from apparently healthy individuals and a better predictor than the presence of known disease or haploinsufficient genes for larger CNVs. The functionally related genes found in the de novo CNVs belonged to 70% of all clusters of functionally related genes found across the genome. De novo CNVs were more likely to affect functional clusters and affect them to a greater extent than benign CNVs (P = 6 × 10(-4)). Furthermore, such clusters of functionally related genes are phenotypically informative: Different patients possessing CNVs that affect the same cluster of functionally related genes exhibit more similar phenotypes than expected (P < 0.05). The spanning of multiple functionally similar genes by single CNVs contributes substantially to how these variants exert their pathogenic effects.


Figures

Figure 1.
Figure 1.
De novo CNVs from patients with developmental disorders contain significantly large numbers of functionally similar genes, as defined by proximity in the phenotypic linkage network (PLN). (Blue) DECIPHER, (red) NIJMEGEN. (A,B) DECIPHER (A) and NIJMEGEN (B) de novo CNVs contain significantly large functional clusters compared to 10,000 gene-number-matched randomizations, the significance of which increases when paralogous genes within the same CNV are collapsed to a single copy. Arrows indicate observed value and P-value. (C) The largest functional cluster is most significant in both data sets. The size of the circle indicates the average cluster size, light gray line indicates P = 0.05, and data sets are offset due to high overlap. (D) Thirty percent of de novo CNVs contain a functional cluster that is larger than expected (points, gray line indicate P = 0.5); shaded areas indicate 95% confidence intervals given a uniform distribution of P-values. The respective patients were not significantly enriched for any phenotype (hypergeometric test with Bonferroni correction). (E,F) More DECIPHER (E) and NIJMEGEN (F) de novo CNVs contain functional clusters compared to 10,000 gene-number-matched randomizations. Only DECIPHER was significantly different. Arrows indicate observed value and P-value.
Figure 2.
Figure 2.
Enrichment of various disease-relevant annotations in functional clusters respectively compared to all genes in their CNVs. The enrichment of disease genes in DECIPHER (A) and NIJMEGEN (B) functional clusters. Recur indicates genes found in more than one de novo CNV in the same data set, HIS-Dang are haploinsufficient genes identified in Dang et al. (2008), OMIM are genes causally related to a disease in the OMIM database (OMIM 2012) and HPO-PS are candidate genes specifically associated with the respective patient's phenotype based on gene-phenotype annotations in the Human Phenotype Ontology database (Dolken et al. 2012). Stars indicate significance: (*) P < 0.05, (**) P < 0.005, (***) P < 0.0005, etc. up to a maximum of five stars. (C) Survivorship curve indicating the frequency of functional cluster genes in recurrent regions compared to CNV genes not belonging to clusters of functionally related genes. The more frequently a gene was seen affected by de novo CNVs, the greater the chance it belongs to a functional cluster.
Figure 3.
Figure 3.
The presence of clusters of functionally related genes in a CNV is a more specific or more sensitive predictor of pathogenicity than the presence of OMIM or HIS genes. The percentage of CNVs which contain at least one functional cluster (have Cluster), disease gene from OMIMan (have OMIM) (OMIM 2012), or haploinsufficient gene (have HIS) from Dang et al. (2008). The height of the DECIPHER (blue) and NIJMEGEN (red) bars indicates the sensitivity of the predictor to pathogenic CNVs, whereas the height of control (gray) bars indicates the specificity of each predictor (a low bar is high specificity), above the bars is the odds ratio (OR) from the combined logistic regression.
Figure 4.
Figure 4.
The human genome contains clusters of functionally related genes. (A) The 933 clusters of functionally related genes are present on all chromosomes examined. Chromosomes are arranged from 1 to X from left to right with functional clusters (orange), yellow bands indicate centromeres, and dark orange bands indicate regions of highly repetitive sequence; the banding pattern was obtained from UCSC Genome Browser hg18 (Rhead et al. 2010). (B,C) The extent of functional clusters compared to 1000 network node-label permutations of the PLN (see Methods), observed functional clusters are indicated by arrows with the respective P-value. The null distribution when paralogs were included is almost identical to that when paralogs were excluded, thus it is mostly hidden behind it in the plots.
Figure 5.
Figure 5.
Clusters of functionally related genes are a better indicator of phenotypic similarity than genes. (A) Patient pairs were placed into six categories based on shared genetic elements. Orange rectangles represent genes. Purple rectangles represent genes belonging to the same genome-wide functional cluster. Black bordered rectangles indicate OMIM disease genes. Black segments indicate the de novo CNVs from two different patients. Only one CNV per patient is included for each situation for simplicity; in cases with multiple de novo CNVs, overlaps between all the CNV(s) of one patient and all the CNVs of the other patient were considered. (B) Phenotype similarity as measured by the Goodall3 index (Boriah et al. 2008) between pairs of patients in each category shown in A: Cluster-and-Genes affect the functional cluster and the same genes; Cluster-and-OMIM affect the same functional cluster and the same OMIM genes; Cluster-only affect the same functional cluster but different genes; Genes-only affect the same genes but not the functional cluster; OMIM-only affect the same OMIM genes but not the same functional cluster. Stars indicate significance, calculated using a Wilcoxon rank-sum test: (*) P < 0.05; (**) P < 0.005; (***) P < 0.0005, etc., up to a maximum of five stars. The red line indicates the median phenotypic similarity over all patient pairs.

References

    1. Al-Shahrour F, Minguez P, Marqués-Bonet T, Gazave E, Navarro A, Dopazo J. 2010. Selection upon genome architecture: conservation of functional neighborhoods with changing genes. PLoS Comput Biol 6: e1000953. - PMC - PubMed
    1. Bass HN. 2002. London dysmorphology database, London neurogenetics database & dysmorphology photo library on CD-ROM. Am J Hum Genet 71: 687.
    1. Bernier R, Gerdts J, Munson J, Dawson G, Estes A. 2012. Evidence for broader autism phenotype characteristics in parents from multiple-incidence autism families. Autism Res 5: 13–20. - PMC - PubMed
    1. Boriah S, Chandola V, Kumar V. 2008. Similarity measures for categorical data: a comparative evaluation. In Proceedings of the eighth SIAM international conference on data mining, pp. 234–254. SIAM, Atlanta, GA.
    1. Boulding H, Webber C. 2012. Large-scale objective association of mouse phenotypes with human symptoms through structural variation identified in patients with developmental disorders. Hum Mutat 33: 874–883. - PubMed

Publication types

LinkOut - more resources