. 2015 Feb 18:16:49.
doi: 10.1186/s12859-015-0476-5.

Sampling with poling-based flux balance analysis: optimal versus sub-optimal flux space analysis of Actinobacillus succinogenes

Affiliations

Sampling with poling-based flux balance analysis: optimal versus sub-optimal flux space analysis of Actinobacillus succinogenes

Michael Binns et al. BMC Bioinformatics. .

Abstract

Background: Flux balance analysis is traditionally implemented to identify the maximum theoretical flux for some specified reaction and a single distribution of flux values for all the reactions present which achieve this maximum value. However it is well known that the uncertainty in reaction networks due to branches, cycles and experimental errors results in a large number of combinations of internal reaction fluxes which can achieve the same optimal flux value.

Results: In this work, we have modified the applied linear objective of flux balance analysis to include a poling penalty function, which pushes each new set of reaction fluxes away from previous solutions generated. Repeated poling-based flux balance analysis generates a sample of different solutions (a characteristic set), which represents all the possible functionality of the reaction network. Compared to existing sampling methods, for the purpose of generating a relatively "small" characteristic set, our new method is shown to obtain a higher coverage than competing methods under most conditions. The influence of the linear objective function on the sampling (the linear bias) constrains optimisation results to a subspace of optimal solutions all producing the same maximal fluxes. Visualisation of reaction fluxes plotted against each other in 2 dimensions with and without the linear bias indicates the existence of correlations between fluxes. This method of sampling is applied to the organism Actinobacillus succinogenes for the production of succinic acid from glycerol.

Conclusions: A new method of sampling for the generation of different flux distributions (sets of individual fluxes satisfying constraints on the steady-state mass balances of intermediates) has been developed using a relatively simple modification of flux balance analysis to include a poling penalty function inside the resulting optimisation objective function. This new methodology can achieve a high coverage of the possible flux space and can be used with and without linear bias to show optimal versus sub-optimal solution spaces. Basic analysis of the Actinobacillus succinogenes system using sampling shows that in order to achieve the maximal succinic acid production CO₂ must be taken into the system. Solutions involving release of CO₂ all give sub-optimal succinic acid production.


Figures

Figure 1
Figure 1
Simple examples illustrating the maximal gap identified for the j th reaction in 4 different samples.
Figure 2
Figure 2
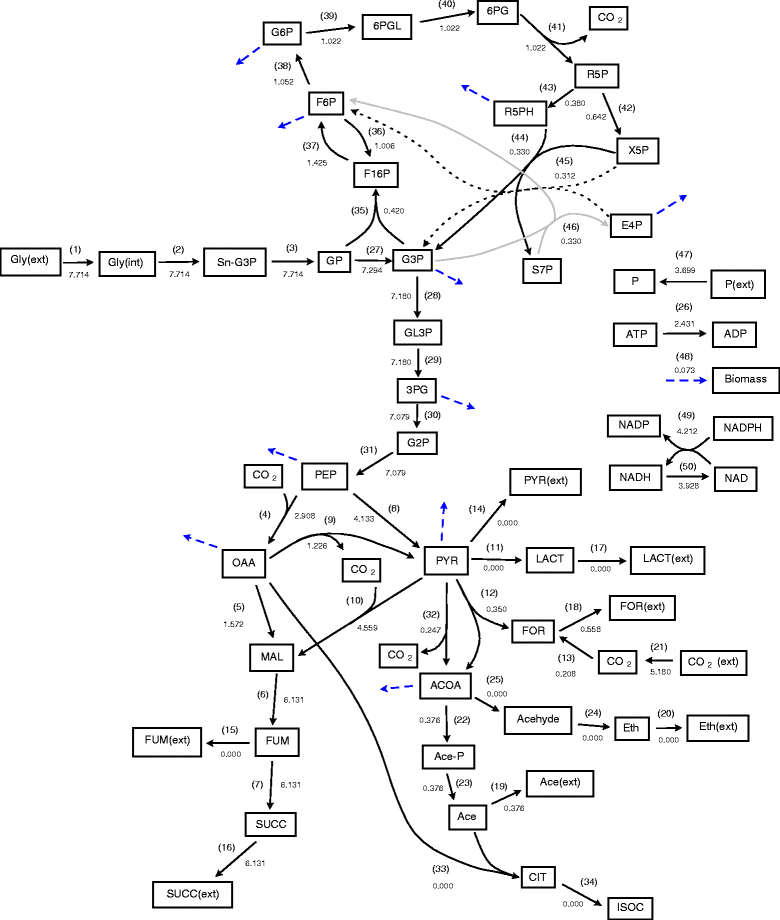
Metabolic reaction network for Actinobacillus succinogenes . Unidirectional arrows indicate steps which are considered to be irreversible, all other steps are assumed to be reversible. Short dashed arrows correspond to reaction 48 indicating the metabolic species contributing to biomass production. For simplicity, explicit consumption or production of ATP, ADP, NAD, NADH, NADPH and NADP is not included in all reactions. However these exchanges were included, e.g. ATP is consumed or produced in reactions 2, 4, 8, 23, 26, 29, 36 and 48.
Figure 3
Figure 3
The first flux distribution obtained through optimisation of equation 4 with F pole = 0. Values to 3 decimal places indicate corresponding flux values.
Figure 4
Figure 4
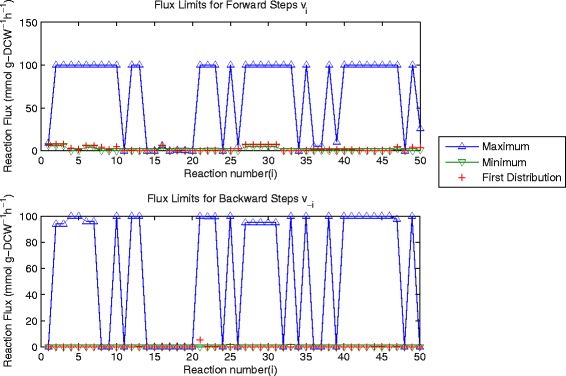
Upper and lower limits for separate forwards and backwards reaction steps of the 1 st flux distribution. These values are computed with Fpole = 0.
Figure 5
Figure 5
Upper and lower limits for overall reaction fluxes (forwards-backward) of the 1 st flux distribution. These values are computed with Fpole = 0.
Figure 6
Figure 6
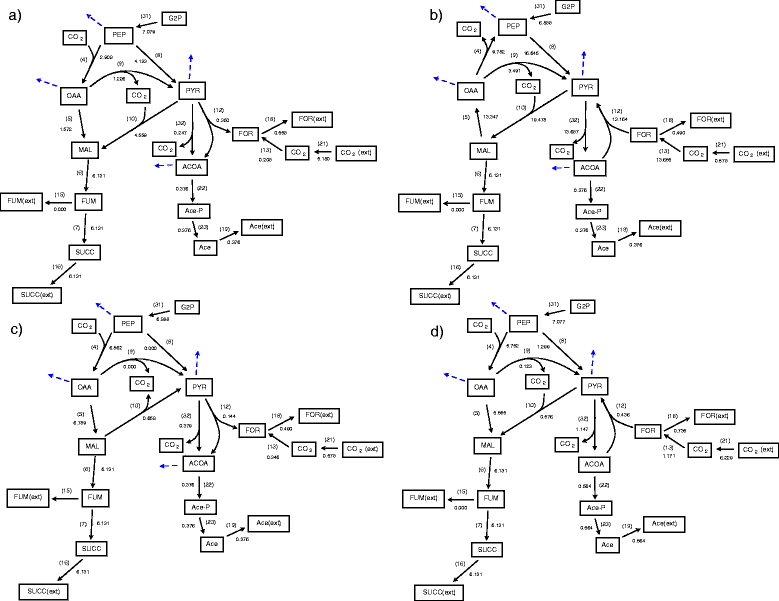
Four flux distributions generated using optimisation of equations 2 , 3 and 4 with poling parameters N=2 and W pole =1. The first (a), second (b), third (c) and fourth (d) flux distributions are depicted on a significant subsection of the reaction network.
Figure 7
Figure 7
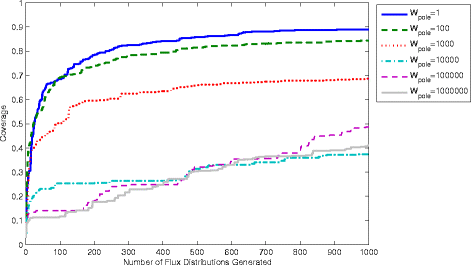
Coverage computed for different values of the poling weight parameter W pole with N=2.
Figure 8
Figure 8
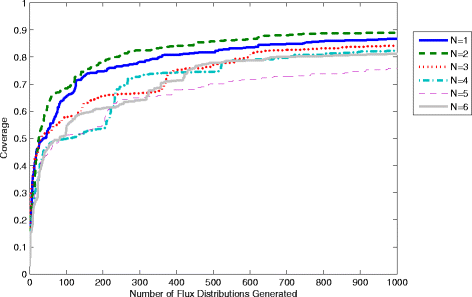
Coverage computed for different values of the poling parameter N with W pole =1.
Figure 9
Figure 9
Three samples generated using poling-based flux sampling with different values of N and W pole . For each sample 1000 flux distributions are generated.
Figure 10
Figure 10
Coverage computed with and without the linear objective using poling parameters W pole =1 and N=2.
Figure 11
Figure 11
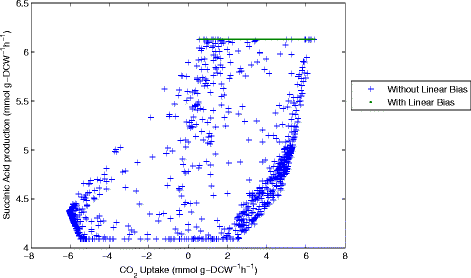
CO 2 uptake plotted against Succinic acid production (flux 16). Samples computed with and without the linear objective are shown for comparison.
Figure 12
Figure 12
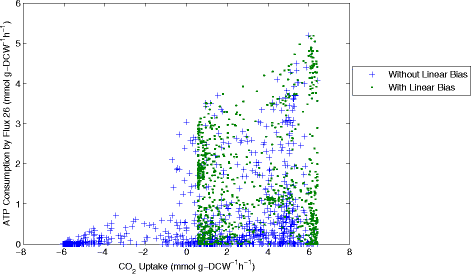
CO 2 uptake plotted against ATP consumption through flux 26. Samples computed with and without the linear objective are shown for comparison.
Figure 13
Figure 13
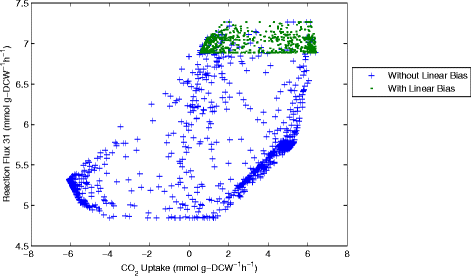
CO 2 uptake plotted against flux 31 (G2P → PEP). Samples computed with and without the linear objective are shown for comparison.
Figure 14
Figure 14
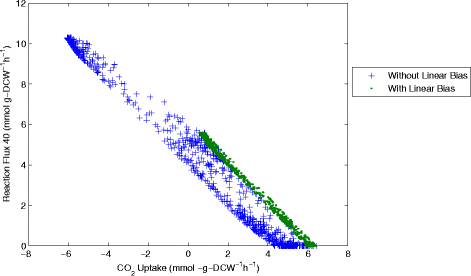
CO 2 uptake plotted against flux 40 (6PGL→6PG). Samples computed with and without the linear objective are shown for comparison.
Figure 15
Figure 15
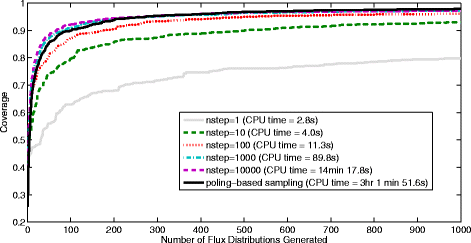
Coverage obtained and CPU times required by the ACHR algorithm compared with poling-based sampling for the Actinobacillus succinogenes case. The ACHR sampling is used here with different numbers of steps per record.
Figure 16
Figure 16
Synthetic reaction network used for comparison of samplinjg methods at large scale. This reaction network contains 7 metabolites labeled A0-A7 and 1002 reaction steps.
Figure 17
Figure 17
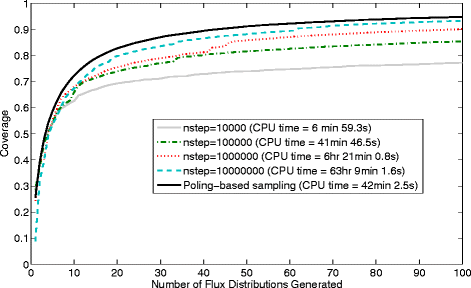
Coverage obtained and CPU times required by the ACHR algorithm compared with poling-based sampling for the large synthetic reaction network case. The ACHR sampling is used here with different numbers of steps per record.
Figure 18
Figure 18
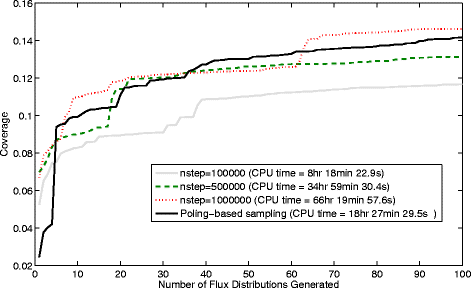
Coverage obtained and CPU times required by the ACHR algorithm compared with poling-based sampling for the E. coli iAF1260 reaction network case. The ACHR sampling is used here with different numbers of steps per record.

References

    1. Thiele I, Palsson BO. A protocol for generating a high-quality genome-scale metabolic reconstruction. Nat Protoc. 2010;5:93–121. doi: 10.1038/nprot.2009.203. - DOI - PMC - PubMed
    1. Binns M, Theodoropoulos C. An integrated knowledge-based approach for modeling biochemical reaction networks. Comput Chem Eng. 2011;35:3025–43. doi: 10.1016/j.compchemeng.2011.03.030. - DOI
    1. Mu F, Unkefer CJ, Unkefer PJ, Hlavacek WS. Prediction of metabolic reactions based on atomic and molecular properties of small molecule compounds. Bioinformatics. 2011;27:1537–45. doi: 10.1093/bioinformatics/btr177. - DOI - PMC - PubMed
    1. Hatzimanikatis V, Li C, Ionita JA, Henry CS, Jankowski MD, Broadbelt LJ. Exploring the diversity of complex metabolic networks. Bioinformatics. 2005;21:1603–9. doi: 10.1093/bioinformatics/bti213. - DOI - PubMed
    1. Schellenberger J, Palsson BO. Use of randomized sampling for analysis of metabolic networks. J Biol Chem. 2009;284:5457–61. doi: 10.1074/jbc.R800048200. - DOI - PubMed

Publication types

MeSH terms