

doi: 10.1186/s13059-015-0612-6.
Systematic identification of cancer driving signaling pathways based on mutual exclusivity of genomic alterations
Affiliations
- PMID: 25887147
- PMCID: PMC4381444
- DOI: 10.1186/s13059-015-0612-6
Item in Clipboard
Systematic identification of cancer driving signaling pathways based on mutual exclusivity of genomic alterations
Genome Biol.
.
Abstract
We present a novel method for the identification of sets of mutually exclusive gene alterations in a given set of genomic profiles. We scan the groups of genes with a common downstream effect on the signaling network, using a mutual exclusivity criterion that ensures that each gene in the group significantly contributes to the mutual exclusivity pattern. We test the method on all available TCGA cancer genomics datasets, and detect multiple previously unreported alterations that show significant mutual exclusivity and are likely to be driver events.
Figures
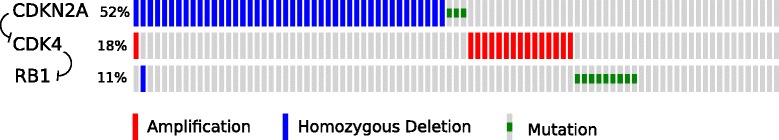
Distribution of CDKN2A, CDK4 and RB1 mutations and copy number changes. These are from the The Cancer Genome Atlas (TCGA) glioblastoma dataset, as provided by cBioPortal. At least one of the genes is altered in 78% of the cases, with an overlap in only two samples. Even though RB1 is mutated only in 11% of the cases, its activity is potentially affected by alterations of the other two genes, which encode for upstream proteins in the signaling network.
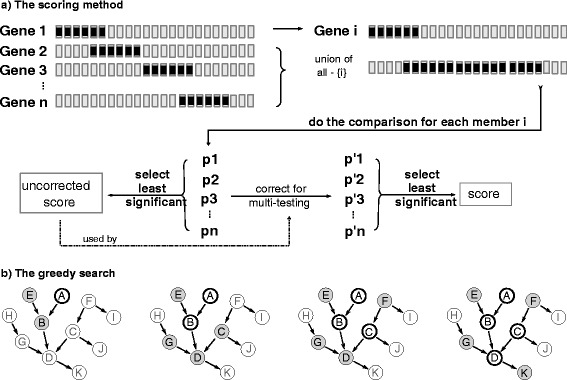
Searching and scoring method.
(a) Mutual exclusivity of a group of gene alterations is evaluated by comparing each gene with the union of the other genes. The initial score is the least significant P value. To correct for multiple hypothesis testing, we estimate the significance of the initial P values during a search with permuted alterations. The least significant of these second P values is the multiple hypothesis testing corrected group score. (b) At each step of the greedy search, we expand the group with the next best candidate gene from the surrounding genes that have a common downstream target with the group members, or they are a common downstream target themselves. In this illustration, four sample steps of the search are shown for a sample network. Thick-bordered genes are current group members and genes with a gray background are candidates for the next expansion. The best-scoring candidate gene is added to the group if it increases the score, and the candidates are re-assessed for the next phase. The search will stop if the group cannot expand anymore or a threshold group size is reached.
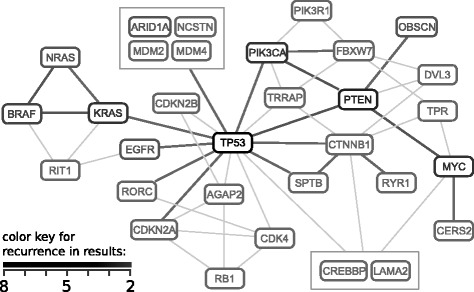
Network constructed using recurrent genes in the results. The genes in the graph appear in the results of at least two different studies. Thick edges represent recurrent co-presence of gene pairs in the same mutually exclusive set. Thin edges represent non-recurrent co-presence of gene pairs, and are only used to connect the genes that lack a recurrent edge. Note that there are many other non-recurrent edges between recurrent genes, which are omitted from the graph to reduce complexity. See Additional file 1: Figure S44 for a complete graph with all non-recurrent genes and co-presences.
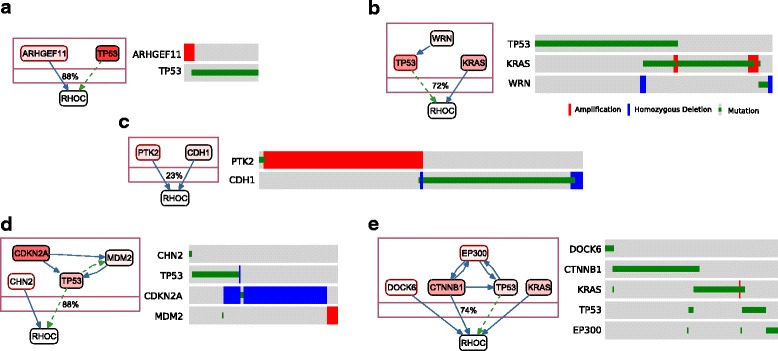
Sample result groups that have RHOC as a common downstream target. Oncoprints are shown at the right of each group and unaltered samples are omitted. Gene color intensities are proportional to gene alteration ratios. In the signaling network, dashed green edges represent transcriptional relations and solid blue edges represent post-translational relations. Genes in the result groups are shown inside a compound node, whose label shows the alteration coverage of samples in the group. This is also equal to the visible portion of samples on the oncoprints. Figure prepared using ChiBE [43,44]. (a) Uterine corpus endometrial carcinoma (CNA dominated 56 samples, 49 altered). (b) Lung adenocarcinoma (218 samples, 160 altered). (c) Breast invasive carcinoma (923 samples, 210 altered). (d) Glioblastoma multiforme (112 samples, 98 altered). (e) Uterine corpus endometrial carcinoma (mutation dominated 155 samples, 110 altered).
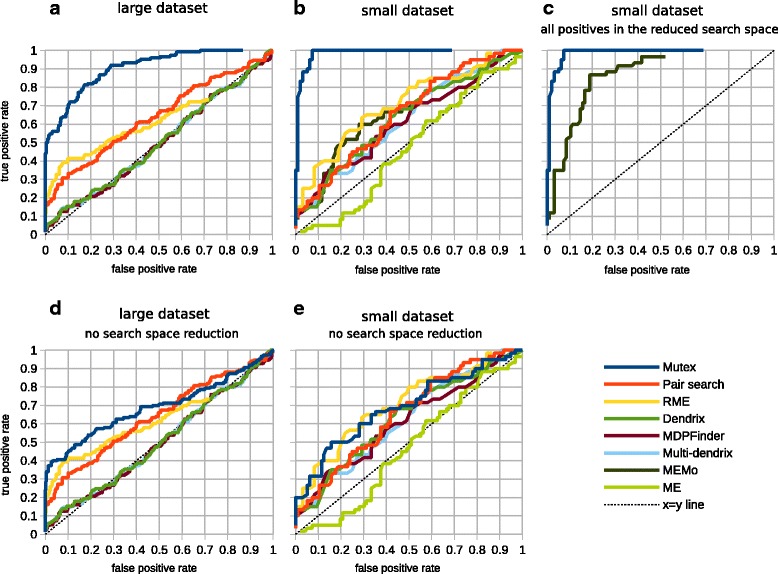
Receiver operating characteristic curve comparisons of methods that detect mutually exclusive alterations for simulated datasets.
(a) Comparison with the large dataset. (b) Comparison with the small dataset. (c) Comparison of methods that do search space reduction (Mutex and MEMo) after ensuring all seeded groups are in the reduced search space of both methods. (d, e) Comparisons after removing the search space reduction of Mutex, for large and small datasets.
References
Publication types
MeSH terms
Substances
Grants and funding
LinkOut - more resources
Full Text Sources
Other Literature Sources
Medical
