. 2015 Feb 13:15:54.
doi: 10.1186/s12879-015-0770-x.

Spatial, temporal and genetic dynamics of highly pathogenic avian influenza A (H5N1) virus in China

Affiliations

Spatial, temporal and genetic dynamics of highly pathogenic avian influenza A (H5N1) virus in China

Huaiyu Tian et al. BMC Infect Dis. .

Abstract

Background: The spatial spread of H5N1 avian influenza, significant ongoing mutations, and long-term persistence of the virus in some geographic regions has had an enormous impact on the poultry industry and presents a serious threat to human health.

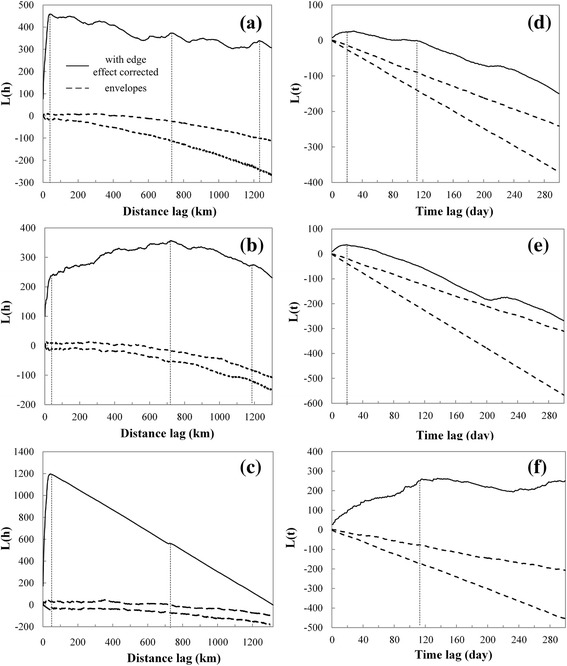
Methods: We applied phylogenetic analysis, geospatial techniques, and time series models to investigate the spatiotemporal pattern of H5N1 outbreaks in China and the effect of vaccination on virus evolution.

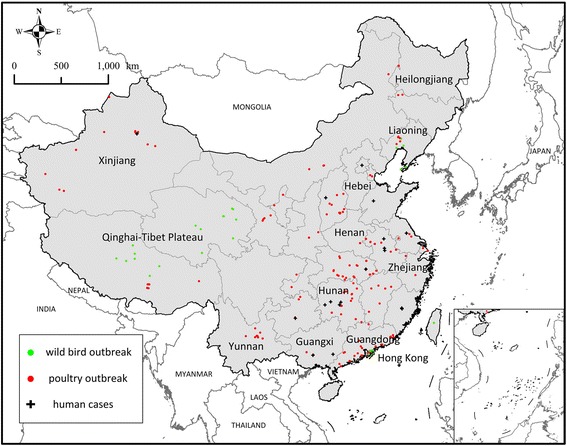
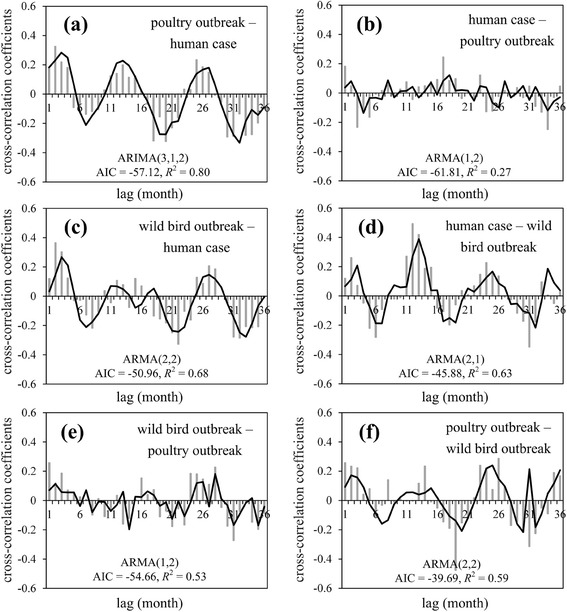
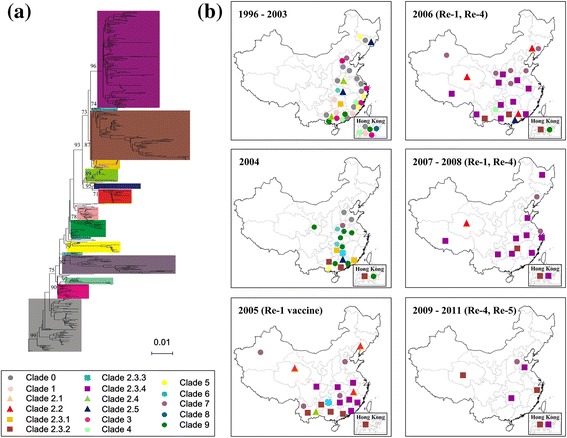
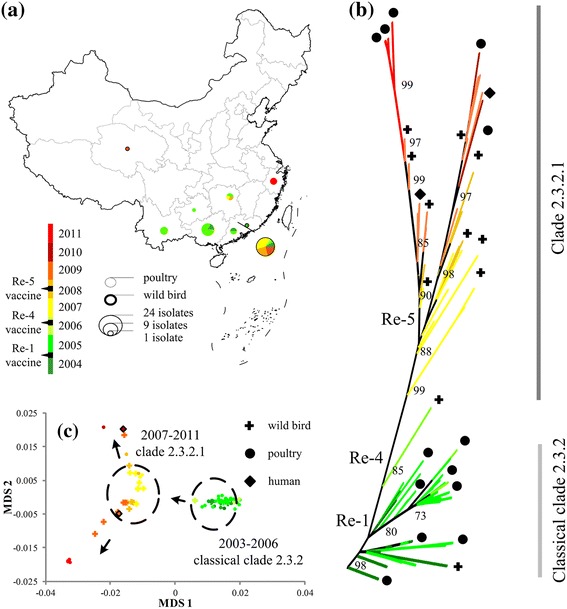
Results: Results showed obvious spatial and temporal clusters of H5N1 outbreaks on different scales, which may have been associated with poultry and wild-bird transmission modes of H5N1 viruses. Lead-lag relationships were found among poultry and wild-bird outbreaks and human cases. Human cases were preceded by poultry outbreaks, and wild-bird outbreaks were led by human cases. Each clade has gained its own unique spatiotemporal and genetic dominance. Genetic diversity of the H5N1 virus decreased significantly between 1996 and 2011; presumably under strong selective pressure of vaccination. Mean evolutionary rates of H5N1 virus increased after vaccination was adopted in China. A clear signature of positively selected sites in the clade 2.3.2 virus was discovered and this may have resulted in the emergence of clade 2.3.2.1.

Conclusions: Our study revealed two different transmission modes of H5N1 viruses in China, and indicated a significant role of poultry in virus dissemination. Furthermore, selective pressure posed by vaccination was found in virus evolution in the country.


Figures

Figure 1
Figure 1
H5N1 virus outbreaks, avian and human cases. Outbreak records in China began in January 2004, and outbreaks were mainly concentrated in four periods: early 2004, late 2005 to early 2006, late 2007 to early 2008, and early 2009.
Figure 2
Figure 2
Temporal and spatial K-function results. Spatial K-function calculated for: (a) all infections, (b) poultry and (c) wild birds. Temporal K-function calculated for: (d) all infections, (e) poultry and (f) wild birds. Clusters are shown by thin dashed lines. The peak value in spatial K-function for wild birds represents the outbreaks in Hong Kong, because of data bias.
Figure 3
Figure 3
Cross-correlation coefficient time series and ARIMA model-fitted curves. (a) Poultry outbreak – human case; (b) human case – poultry outbreak; (c) wild-bird outbreak – human case; (d) human case – wild-bird outbreak; (e) wild-bird outbreak – poultry outbreak; and (f) poultry outbreak – wild-bird outbreak. Thick lines are best-fit results of cross-correlation coefficient time series by ARIMA modeling.
Figure 4
Figure 4
Spatiotemporal distribution of different virus clades isolated from birds in China, 1996–2011. (a) Phylogenetic tree based on H5N1 HA gene sequences. (b) Distribution of H5N1 virus isolated from birds in China, 1996–2011. The definition criteria of clades were developed by the WHO/OIE/FAO H5N1 Evolution Working Group: sharing of a common (clade-defining) node in the phylogenetic tree; monophyletic grouping with a bootstrap value ≥60 at the clade-defining node; and average percentage pairwise nucleotide distances between and within clades of >1.5% and <1.5%, respectively.
Figure 5
Figure 5
Distribution of prevailing H5N1 virus clades in China. (a) Clade 0; (b) clade 2.3.2; (c) clade 2.3.4; (d) clade 7. Thin black line represents latitude of Yangtze River. Circle size is proportional to sample size, with smallest circle representing one sample, and largest 18 samples.
Figure 6
Figure 6
Clade 2.3.2 virus in China. (a) Map of China with clade 2.3.2 isolates from animals. (b) Phylogenetics of H5N1 HA. (c) Genetic map of HA sequences.
Figure 7
Figure 7
Detection of positively-selected sites. (a) Positively Selected Sites. dN/dS ratio compared with Re-1 vaccine. (b) dN/dS compared with Re-4 vaccine. Black lines are the mean dN/dS values of virus strains after vaccination was implemented, compared with the corresponding vaccine antigen. Mean dN/dS values of virus before vaccination was implemented are shown by green dashed lines.

References

    1. Tian H, Zhou S, Dong L, Van Boeckel TP, Pei Y, Wu Q et al. Climate change suggests a shift of H5N1 risk in migratory birds. Ecol Model. 2014, doi:10.1016/j.ecolmodel.2014.08.005.
    1. Webster RG, Govorkova EA. H5N1 influenza–continuing evolution and spread. N Engl J Med. 2006;355(21):2174–7. doi: 10.1056/NEJMp068205. - DOI - PubMed
    1. Carrel M, Wan X-F, Nguyen T, Emch M. Highly pathogenic H5N1 avian influenza viruses exhibit few barriers to gene flow in Vietnam. Ecohealth. 2012;9(1):60–9. doi: 10.1007/s10393-012-0749-7. - DOI - PMC - PubMed
    1. Carrel M, Wan X-F, Nguyen T, Emch M. Genetic Variation of highly pathogenic H5N1 avian influenza viruses in vietnam shows both species-specific and spatiotemporal associations. Avian Dis. 2011;55(4):659–66. doi: 10.1637/9785-051811-Reg.1. - DOI - PMC - PubMed
    1. Xu X, Subbarao, Cox NJ, Guo Y. Genetic characterization of the pathogenic influenza A/Goose/Guangdong/1/96 (H5N1) virus: similarity of its hemagglutinin gene to those of H5N1 viruses from the 1997 outbreaks in Hong Kong. Virology. 1999;261(1):15–9. doi: 10.1006/viro.1999.9820. - DOI - PubMed

Publication types

MeSH terms