. 2015 Jun;14(6):1720-30.
doi: 10.1074/mcp.M114.045856. Epub 2015 Apr 17.

GAG-ID: Heparan Sulfate (HS) and Heparin Glycosaminoglycan High-Throughput Identification Software

Affiliations

GAG-ID: Heparan Sulfate (HS) and Heparin Glycosaminoglycan High-Throughput Identification Software

Yulun Chiu et al. Mol Cell Proteomics. 2015 Jun.

Abstract

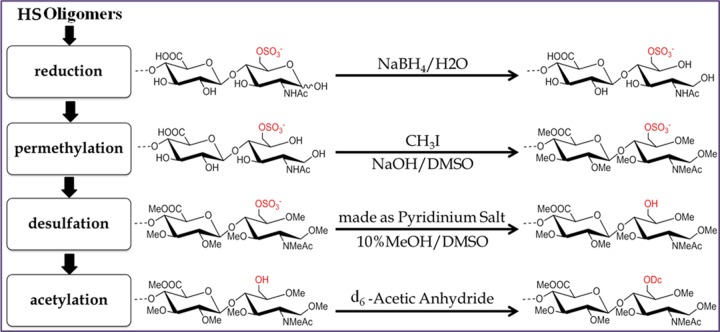
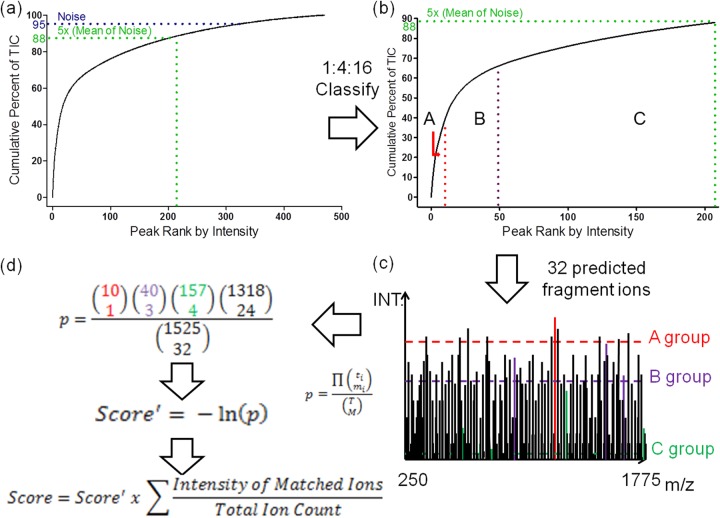
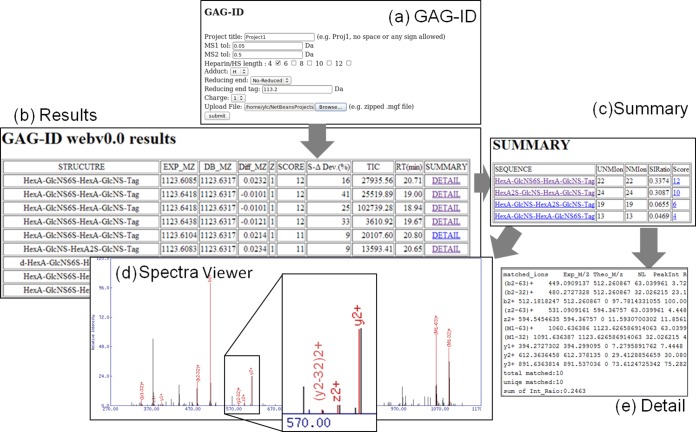
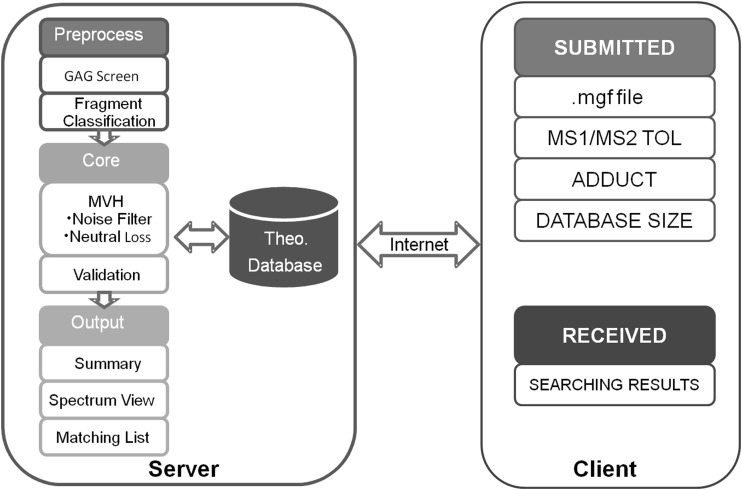
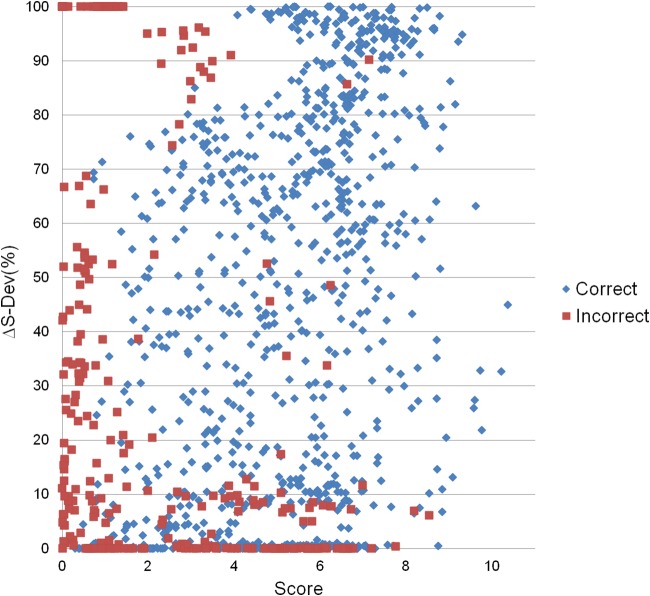
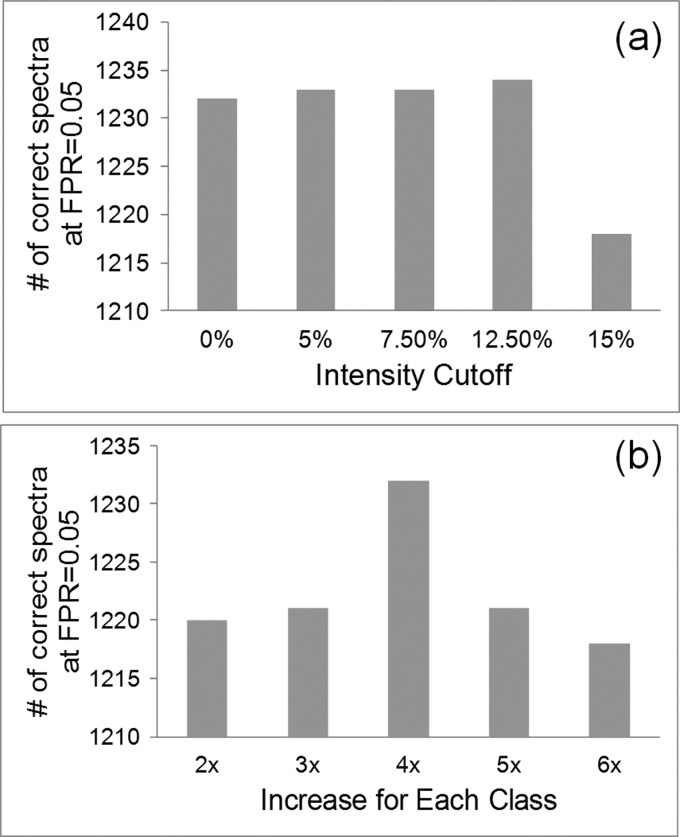
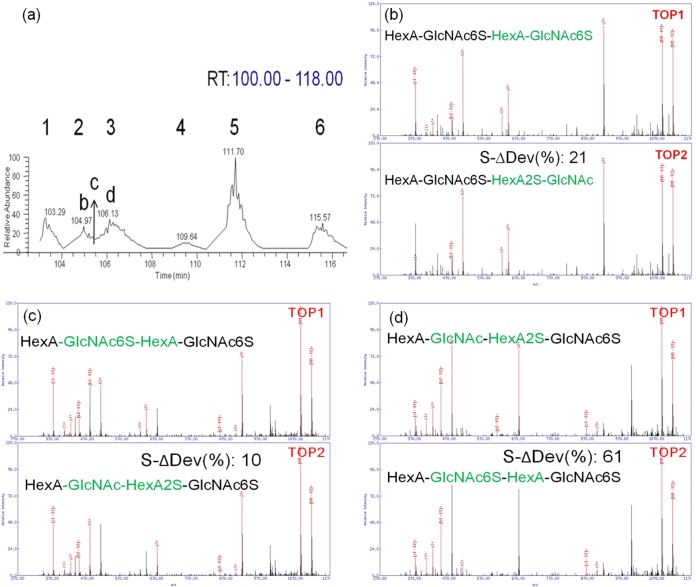
Heparin and heparan sulfate are very large linear polysaccharides that undergo a complex variety of modifications and are known to play important roles in human development, cell-cell communication and disease. Sequencing of highly sulfated glycosaminoglycan oligosaccharides like heparin and heparan sulfate by liquid chromatography-tandem mass spectrometry (LC-MS/MS) remains challenging because of the presence of multiple isomeric sequences in a complex mixture of oligosaccharides, the difficulties in separation of these isomers, and the facile loss of sulfates in MS/MS. We have previously introduced a method for structural sequencing of heparin/heparan sulfate oligosaccharides involving chemical derivatizations that replace labile sulfates with stable acetyl groups. This chemical derivatization scheme allows the use of reversed phase LC for high-resolution separation and MS/MS for sequencing of isomeric heparan sulfate oligosaccharides. However, because of the large number of analytes present in complex mixtures of heparin/HS oligosaccharides, the resulting LC-MS/MS data sets are large and cannot be annotated with existing glycomics software because of the specifically designed chemical derivatization strategy. We have developed a tool, called GAG-ID, to automate the interpretation of derivatized heparin/heparan sulfate LC-MS/MS data based on a modified multivariate hypergeometric distribution to weight the annotation of more intense peaks. The software is tested on a LC-MS/MS data set collected from a mixture of 21 synthesized heparan sulfate tetrasaccharides. By testing the discrimination of scoring with this system, we show that stratifying peaks into different intensity classes benefits the discrimination of scoring, and GAG-ID is able to properly assign all 21 synthetic tetrasaccharides in a defined mixture from a single LC-MS/MS run.


Figures

Fig. 1.
Fig. 1.
Chemical derivatizations of HS Oligogmers. Before MS/MS analysis, sequential chemical derivatizations were applied to HS oligomers, including permethylation, desulfation, and acetylation steps. d6-labeled acetic anhydride was used to differentiate the N-acetylated and N-sulfated amino-sugars, giving mass difference of 3Da for -COCH3. [Me:-CH3, Ac:-COCH3, Dc:-COCD3]
Fig. 2.
Fig. 2.
Matching and Scoring. A, During preprocessing, the fragment ions for each spectrum are sorted by intensity in decreasing order. The cumulative intensity from the most intense peak to the least intense peak is computed (represented by the curve). A fraction of the original TIC is retained (in this case, 88%), with the remaining peaks stripped out as minor peaks which often represent background noise or uncommon fragment ions not included in our theoretical database (e.g. minor cross-ring cleavages). B, The remaining peaks are split into classes, each of which has four times as many members as the previous class and are sorted by abundance. In this example, three classes were divided and marked as A, B, and C representatively with a population ratio of 1:4:16. C, An example shows how peaks matched to theoretical predicted fragment ions within the specified m/z tolerance (in this case 32 peaks out of 1525 bins are matched) are classified into different groups. D, A score', represented by the negative of the log probability, is reported. To penalize noisy spectra, the final score consists of score' weighted by the ratio of the summation of the ion current that is explained by the fragmentation model to the summation of the total product ion current.
Fig. 3.
Fig. 3.
Screenshot of GAG-ID interface and report. The GAG result was generated with .mgf format of MS/MS spectra and parameters searched against the GAG-DB. A, The interface of GAG-ID data submission. Several parameters are required, including project name, tolerance for MS and MS/MS, database, HS length, modifications and input peak list (.mgf format). B, Results. The MS/MS search results, including experimental m/z (EXP MZ), theoretical m/z (DB MZ), difference between experimental and theoretical m/z (Diff MZ), charge (Z), Score, Delta deviation (S-ΔDev(%)), Total Ion Count (TIC), Retention Time(RT(min)), and a clickable link to the Summary page. C, Summary. The Summary page, listing the isomeric structures matched to that MS/MS spectrum with a score greater than zero, including sequence, number of unique matched ions (UNMIon), a summation of ion ratio matched (SIRatio), and score. D, SpectraViewer. When a sequence is clicked in Summary, the MS/MS data complete with peak annotation is presented by the spectra viewer. E, Detail. When a score is clicked in Summary, tabulated details of the matched fragment ions are listed for export by the user.
Fig. 4.
Fig. 4.
GAG-ID web application. The web application allows users to analyze the LC-MS/MS spectrum for HS through the internet, including inputting search parameters and uploading the .mgf file from the client. The .mgf file will be processed, scored and summarized into the downloadable results package from server client.
Fig. 5.
Fig. 5.
Score versus S-ΔDev (%). The S-ΔDev (%) plotted versus the score reported by GAG-ID. The segregation of correct hits from a defined synthetic mixture of 21 tetrasaccharides (blue diamonds) versus incorrect hits (red boxes) indicate not only discrimination from the score value itself but also discrimination based on the confidence of score as represented by the S-ΔDev (%) value.
Fig. 6.
Fig. 6.
Evaluation. GAG-ID performance was evaluated using different thresholding and scoring configurations. The ability of each configuration to identify the largest number of correct hits in a defined mixture at a real FPR of 0.05 was tested. A, The intensity threshold was tested starting from 0% (no cutoff), 5% (absolute lowest 5% abundant peaks), 7.5%(three times the average of the lowest 5% abundant peaks), 12.5%(five times the average of the lowest 5% abundant peaks), and 15% (six times the average of the lowest 5% abundant peaks). B, Class sizes were in a ratio of N: 1 (n = 2, 3, 4, 5, and 6) for a three class system, with the most intense peaks residing in the smallest class.
Fig. 7.
Fig. 7.
HS Mixture. The species of m/z 1148. 609 has six synthesized isomeric tetramer structures in our defined mixture. A, The six major peaks were separated by LC. For the peaks that were fully resolved chromatographically (shown in B and D), our scoring function reported that their delta deviation were relatively large (i.e. >20). D, For chromatographically unresolved areas of the LC run (shown in C), our scoring function reported a low delta deviation (<15) with a relatively high score, indicating the presence of multiple isobaric species in the same MS/MS spectrum. The top two assignments from GAG-ID represented the two isomeric components cofragmented in the chimeric MS/MS spectrum.

References

    1. Tumova S., Woods A., Couchman J. R. (2000) Heparan sulfate proteoglycans on the cell surface: versatile coordinators of cellular functions. Int. J. Biochem. Cell Biol. 32, 269–288 - PubMed
    1. Sassaki G. L., Riter D. S., Santana Filho A. P., Guerrini M., Lima M. A., Cosentino C., Souza L. M., Cipriani T. R., Rudd T. R., Nader H. B., Yates E. A., Gorin P. A., Torri G., Iacomini M. (2011) A robust method to quantify low molecular weight contaminants in heparin: detection of tris(2-n-butoxyethyl) phosphate. Analyst 136, 2330–2338 - PubMed
    1. Mitsiadis T. A., Salmivirta M., Muramatsu T., Muramatsu H., Rauvala H., Lehtonen E., Jalkanen M., Thesleff I. (1995) Expression of the heparin-binding cytokines, midkine (MK), and HB-GAM (pleiotrophin) is associated with epithelial-mesenchymal interactions during fetal development and organogenesis. Development 121, 37–51 - PubMed
    1. Makarenkova H. P., Hoffman M. P., Beenken A., Eliseenkova A. V., Meech R., Tsau C., Patel V. N., Lang R. A., Mohammadi M. (2009) Differential interactions of FGFs with heparan sulfate control gradient formation and branching morphogenesis. Sci. Signal. 2, ra55. - PMC - PubMed
    1. Muramatsu T., Muramatsu H. (2008) Glycosaminoglycan-binding cytokines as tumor markers. Proteomics 8, 3350–3359 - PubMed

Publication types