. 2015 Apr 13;16(1):294.
doi: 10.1186/s12864-015-1491-7.

Leaps and lulls in the developmental transcriptome of Dictyostelium discoideum

Affiliations

Leaps and lulls in the developmental transcriptome of Dictyostelium discoideum

Rafael David Rosengarten et al. BMC Genomics. .

Abstract

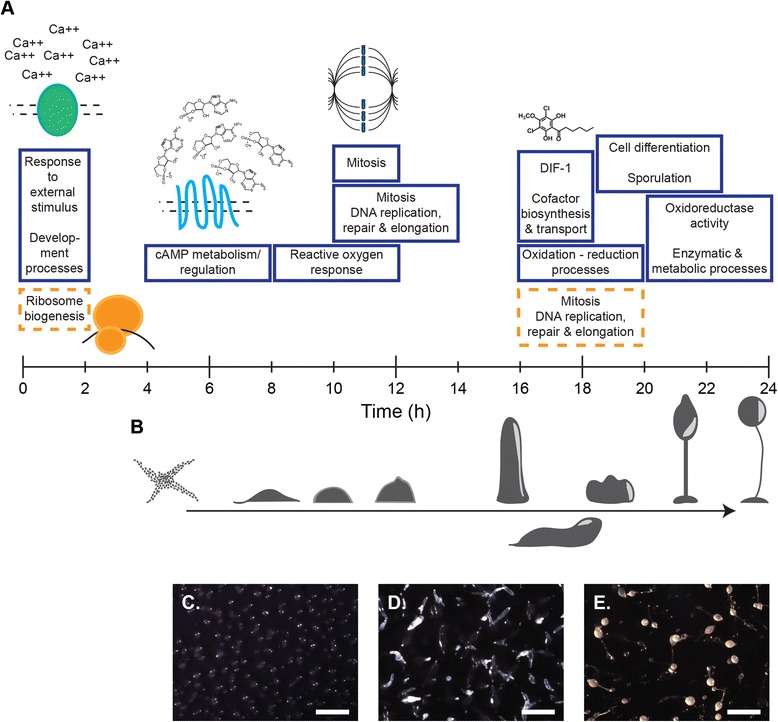
Background: Development of the soil amoeba Dictyostelium discoideum is triggered by starvation. When placed on a solid substrate, the starving solitary amoebae cease growth, communicate via extracellular cAMP, aggregate by tens of thousands and develop into multicellular organisms. Early phases of the developmental program are often studied in cells starved in suspension while cAMP is provided exogenously. Previous studies revealed massive shifts in the transcriptome under both developmental conditions and a close relationship between gene expression and morphogenesis, but were limited by the sampling frequency and the resolution of the methods.

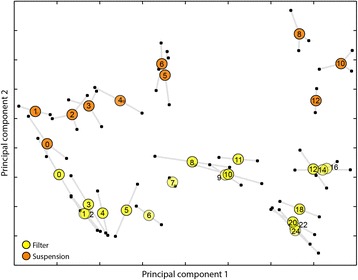
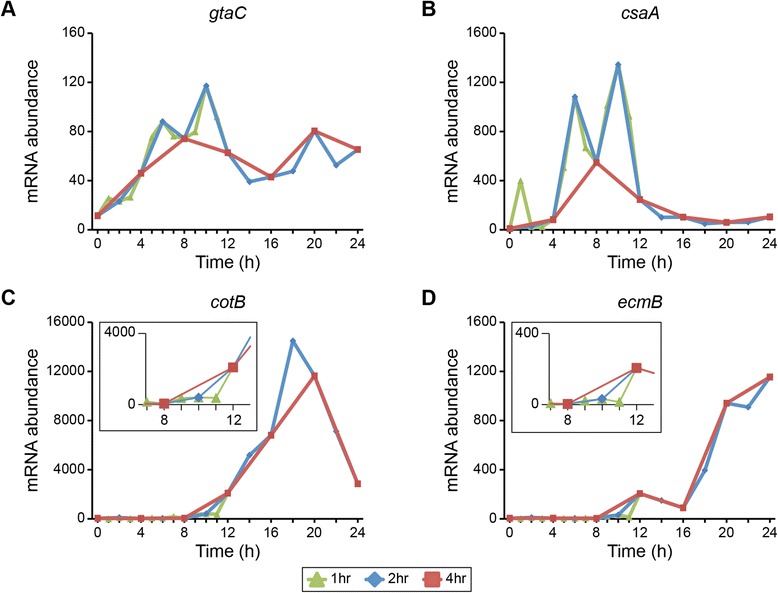
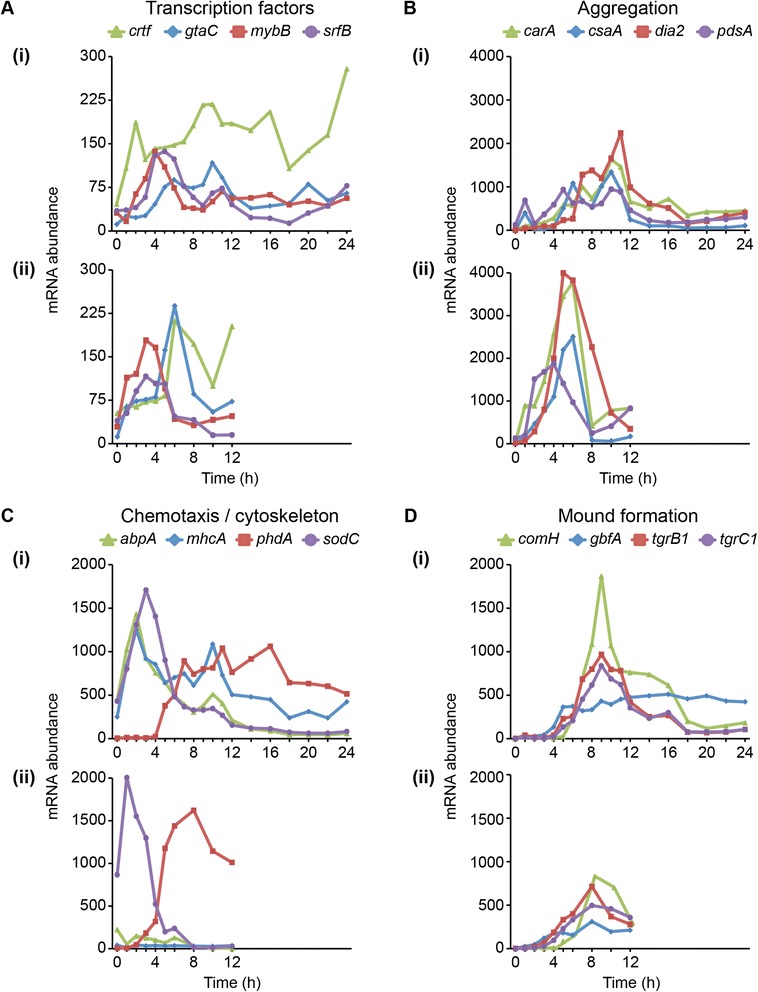
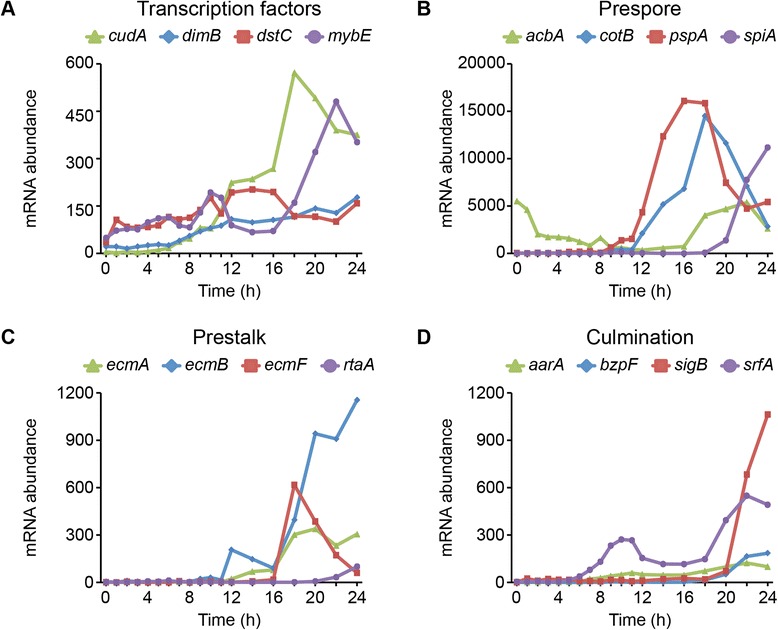
Results: Here, we combine the superior depth and specificity of RNA-seq-based analysis of mRNA abundance with high frequency sampling during filter development and cAMP pulsing in suspension. We found that the developmental transcriptome exhibits mostly gradual changes interspersed by a few instances of large shifts. For each time point we treated the entire transcriptome as single phenotype, and were able to characterize development as groups of similar time points separated by gaps. The grouped time points represented gradual changes in mRNA abundance, or molecular phenotype, and the gaps represented times during which many genes are differentially expressed rapidly, and thus the phenotype changes dramatically. Comparing developmental experiments revealed that gene expression in filter developed cells lagged behind those treated with exogenous cAMP in suspension. The high sampling frequency revealed many genes whose regulation is reproducibly more complex than indicated by previous studies. Gene Ontology enrichment analysis suggested that the transition to multicellularity coincided with rapid accumulation of transcripts associated with DNA processes and mitosis. Later development included the up-regulation of organic signaling molecules and co-factor biosynthesis. Our analysis also demonstrated a high level of synchrony among the developing structures throughout development.

Conclusions: Our data describe D. discoideum development as a series of coordinated cellular and multicellular activities. Coordination occurred within fields of aggregating cells and among multicellular bodies, such as mounds or migratory slugs that experience both cell-cell contact and various soluble signaling regimes. These time courses, sampled at the highest temporal resolution to date in this system, provide a comprehensive resource for studies of developmental gene expression.


Figures

Figure 1
Figure 1
Uneven developmental progression is revealed by transcriptome time course trajectories. We developed cells on filters (yellow circles) and treated cells with cAMP in suspension (orange circles) in separate experiments. We analyzed the transcriptomes by RNA-sequencing and performed principal component analysis (PCA) to reduce the high dimensionality of the data. Both experiments were analyzed using 8,040 expressed genes intersecting the two data sets. For the filter time series, principal component 1 (PC1) and PC2 accounted for 28.6% and 19.6% of the variation, respectively. For the suspension experiment, PC1 and PC2 encompassed 31.2% and 17.3% of the variation, respectively. Plotting the second principal component (PC) (vertical axis) versus the first PC (horizontal axis) illustrates the prevailing patterns in transcriptional progression. The filter series contains two replicates of 19 time points. The suspension series contains two replicates with 10 time points and a third replicate with 9 time points (missing hour 12). For every time point we projected each sample transcriptome as a small black circle connected by whiskers to the other replicate(s). Large colored circles are placed at the center of the transcriptome projection replicates. The axes units are arbitrary.
Figure 2
Figure 2
Temporal resolution affects the interpretation of transcription profiles. The standardized mRNA abundance of four developmentally regulated genes (y-axis) is plotted versus time (hours, x-axis). Data are from the filter development experiment. For each gene—gtaC (A), csaA (B), cotB (C), and ecmB (D)—expression values are included for time points at 1-, 2- and 4-hour intervals, as indicated in the legend below the figure. Each data point represents the average of 2 independent biological replicates. The y-axis scale varies between plots. The insets in (C) and (D) highlight the 8 h – 12 h time frame.
Figure 3
Figure 3
Early development mRNA abundance reflects cAMP experience and physical contact. The standardized mRNA abundance of genes involved in early development (y-axis) is plotted versus time (hours, x-axis). We grouped the genes based on general functional class or developmental process in which they are involved, as indicated above the panels. Legends above the panels indicate the gene names. For each gene category (A – D), data from the filter experiment are shown in the top panel (i) and data from the suspension experiment in the bottom panel (ii). Within each category, the vertical axis scale is constant to facilitate direct comparisons between filter development and liquid suspension. Between categories, the vertical axis scale varies to accommodate different levels of gene expression. Each data point represents the average of 2–3 independent biological replicates as indicated in Figure 1.
Figure 4
Figure 4
Cell-type specification coincides with major changes in transcriptome phenotype. The standardized mRNA abundance of genes involved in later development (y-axis) is plotted versus time (hours, x-axis). Data are from the filter development experiment. We grouped the genes based on general functional class or developmental process in which they are involved (A – D), as indicated above the panels. Legends above the panels indicate the gene names. The vertical axis scale varies to accommodate different levels of gene expression. Each data point represents the average of 2 independent biological replicates.
Figure 5
Figure 5
Differential expression of functional modules during development. For the filter development experiment, we analyzed the GO term enrichment for all DE genes in the rapid and gradual k-hop intervals at each time point (see Additional file 1: Figure S5A). (A) Selected terms are illustrated over the 24-hour developmental timeline. Solid blue boxes correspond to up-regulated genes and dashed orange boxes to down-regulated genes. The width of each box indicates the time delta in which the corresponding GO term is enriched. (B) A cartoon of developmental morphogenesis, with micrographs corresponding to (C) 12-hour mounds, (D) 16-hour slugs, and (E) 24-hour fruiting bodies. Micrograph scale bars represent 1 mm.

References

    1. Raper K. Pseudoplasmodium formation and organization in Dictyostelium discoideum. J Elisha Mitchell Sci Soc. 1940;56:241–282.
    1. Williams JG. Dictyostelium finds new roles to model. Genetics. 2010;185:717–726. doi: 10.1534/genetics.110.119297. - DOI - PMC - PubMed
    1. Kessin RH. Dictyostelium: evolution, cell biology, and development of multicellularity. Cambridge, UK: Cambridge University Press; 2001.
    1. Van Driessche N, Shaw C, Katoh M, Morio T, Sucgang R, Ibarra M, et al. A transcriptional profile of multicellular development in Dictyostelium discoideum. Development. 2002;129:1543–1552. - PubMed
    1. Sussman R, Sussman M. Cultivation of Dictyostelium discoideum in axenic medium. Biochem Biophys Res Commun. 1967;29:53–55. doi: 10.1016/0006-291X(67)90539-6. - DOI - PubMed

Publication types