. 2015 Mar 25:16:99.
doi: 10.1186/s12859-015-0511-6.

Automatic segmentation of deep intracerebral electrodes in computed tomography scans

Affiliations

Automatic segmentation of deep intracerebral electrodes in computed tomography scans

Gabriele Arnulfo et al. BMC Bioinformatics. .

Abstract

Background: Invasive monitoring of brain activity by means of intracerebral electrodes is widely practiced to improve pre-surgical seizure onset zone localization in patients with medically refractory seizures. Stereo-Electroencephalography (SEEG) is mainly used to localize the epileptogenic zone and a precise knowledge of the location of the electrodes is expected to facilitate the recordings interpretation and the planning of resective surgery. However, the localization of intracerebral electrodes on post-implant acquisitions is usually time-consuming (i.e., manual segmentation), it requires advanced 3D visualization tools, and it needs the supervision of trained medical doctors in order to minimize the errors. In this paper we propose an automated segmentation algorithm specifically designed to segment SEEG contacts from a thresholded post-implant Cone-Beam CT volume (0.4 mm, 0.4 mm, 0.8 mm). The algorithm relies on the planned position of target and entry points for each electrode as a first estimation of electrode axis. We implemented the proposed algorithm into DEETO, an open source C++ prototype based on ITK library.

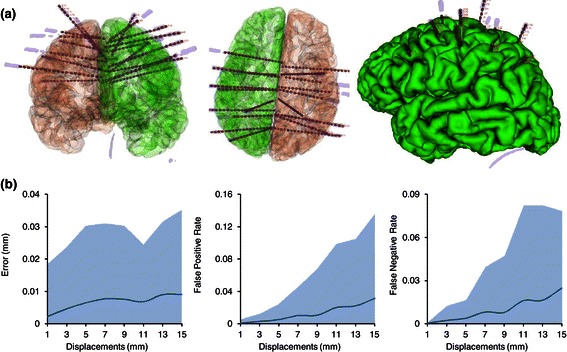
Results: We tested our implementation on a cohort of 28 subjects in total. The experimental analysis, carried out over a subset of 12 subjects (35 multilead electrodes; 200 contacts) manually segmented by experts, show that the algorithm: (i) is faster than manual segmentation (i.e., less than 1s/subject versus a few hours) (ii) is reliable, with an error of 0.5 mm ± 0.06 mm, and (iii) it accurately maps SEEG implants to their anatomical regions improving the interpretability of electrophysiological traces for both clinical and research studies. Moreover, using the 28-subject cohort we show here that the algorithm is also robust (error < 0.005 mm) against deep-brain displacements (< 12 mm) of the implanted electrode shaft from those planned before surgery.

Conclusions: Our method represents, to the best of our knowledge, the first automatic algorithm for the segmentation of SEEG electrodes. The method can be used to accurately identify the neuroanatomical loci of SEEG electrode contacts by a non-expert in a fast and reliable manner.


Figures

Figure 1
Figure 1
Examples of a CT scan of a (tipical) SEEG implant, characterized by a high number of electrodes (targetting deep brain structures from the cortical surfaces). (a) Gray-scale surface models representing an example of image resulting from a CT scan opportunely thresholded to separate between contact and brain tissue. (b) SEEG implants aim to characterize the EZ thus it is quite common that several electrodes have narrow trajectories pointing at the same region from different sides. The artifact around each contact that blurs the exact geometry of the cylinder results in electrodes that apparently touch each other or (c) even apparently seem to be sequential traversing the whole brain.
Figure 2
Figure 2
Results of the DEETO algorithm on complex scenarios. (a) The figure shows the accuracy of the reconstructed implant. The complexity of SEEG implants is well represented in the figure where it can be easily seen the high number of electrodes used, their direction, and their proximity to each others. Moreover, we superimposed pial surfaces (green - left and red - right) extracted from the MRI previously coregistered to CT space. Original electrode surface models extracted from patient CT (shaded gray) are overlayed by segmented contacts (red cylinder) with their real dimensions (i.e., each cylinder is 2 mm long, 0.8 mm diameter and inter-contact distance is 1.5 mm). (b) The proposed implementation is robust to target point displacements. Target displacements (left plot) up to 12 mm from planned site result in an average error of 0.005 mm (blue line). The number of False Positive (FP; central plot) and False Negative (FN; right plot) divided by the total number of real contacts increase with target point displacements but remained below 10% for distances up to 13 mm. Shaded area in all plots indicate the interval between the 95th and the 5th percentiles extracted from 28 subjects and 5 samples for each distance (see methods for details).
Figure 3
Figure 3
An Example of the result of algorithm reconstruction. The reconstructed centroids (red or blue spheres) are confidently representing the center of each original contact (shaded gray) visually assessing the accuracy of the method (a) even in presence of SEEG specific problems such as (b) crossing or (c) touching electrodes.
Figure 4
Figure 4
An example of the head point computation of the Electrode Axis Estimation step. (a) in a region R the algorithm looks for a point, C 0, with an intensity value greater than the threshold. If such point does not exist the region size is increased, R , until the point is found. In (b) the algorithm compute the center of mass of a region R centered in C 0. This step is iterated, C k, until the point C k is equivalent to C k−1. In (c) the point C k will be used as head point point (H) in later analysis steps.
Figure 5
Figure 5
An example of the behaviour of the algorithm in the Electrode Axis Estimation step. (a)This panel represents the result of the algorithm, i.e., the axis (r H,D) and each axis point, A k, computed at each iteration, while the other three figures represent the steps executed at each iteration: (b) represent the computation of a point s, on the line connecting the two previous computed axis points, A k−1 and A k−2, with distance d from the point A k−1; (c) is the computation of a point q 0 that it is the point with the higher intensity value in “cubic” region R centered in s; (d) represent the computation of the axis point A k, i.e., the center of mass of a region R centered in q 0.

References

    1. Lachaux J-P, Axmacher N, Mormann F, Halgren E, Crone NE. High-frequency neural activity and human cognition: past, present and possible future of intracranial EEG research. Prog Neurobiol. 2012;98(3):279–301. doi: 10.1016/j.pneurobio.2012.06.008. - DOI - PMC - PubMed
    1. Perrone-Bertolotti M, Kujala J, Vidal JR, Hamame CM, Ossandon T, Bertrand O, et al. How silent is silent reading? Intracerebral evidence for top-down activation of temporal voice areas during reading. J Neurosci. 2012;32(49):17554–62. doi: 10.1523/JNEUROSCI.2982-12.2012. - DOI - PMC - PubMed
    1. Kühn AA, Williams D, Kupsch A, Limousin P, Hariz M, Schneider G-H, et al. Event-related beta desynchronization in human subthalamic nucleus correlates with motor performance. Brain. 2004;127(Pt 4):735–46. doi: 10.1093/brain/awh106. - DOI - PubMed
    1. Rektor I, Kaiiovský P, Bares M, Brázdil M, Streitová H, Klajblová H, et al. A SEEG study of ERP in motor and premotor cortices and in the basal ganglia. Clin Neurophysiol. 2003;114(3):463–71. doi: 10.1016/S1388-2457(02)00388-7. - DOI - PubMed
    1. Jerbi K, Vidal JR, Ossandon T, Dalal SS, Jung J, Hoffmann D, et al. Exploring the electrophysiological correlates of the default mode network with intracerebral EEG. Front Hum Neurosci. 2010;4:1–9. - PMC - PubMed

Publication types