. 2015 Mar 12;16(1):174.
doi: 10.1186/s12864-015-1378-7.

Metagenomic analysis of the Rhinopithecus bieti fecal microbiome reveals a broad diversity of bacterial and glycoside hydrolase profiles related to lignocellulose degradation

Affiliations

Metagenomic analysis of the Rhinopithecus bieti fecal microbiome reveals a broad diversity of bacterial and glycoside hydrolase profiles related to lignocellulose degradation

Bo Xu et al. BMC Genomics. .

Abstract

Background: The animal gastrointestinal tract contains a complex community of microbes, whose composition ultimately reflects the co-evolution of microorganisms with their animal host and the diet adopted by the host. Although the importance of gut microbiota of humans has been well demonstrated, there is a paucity of research regarding non-human primates (NHPs), especially herbivorous NHPs.

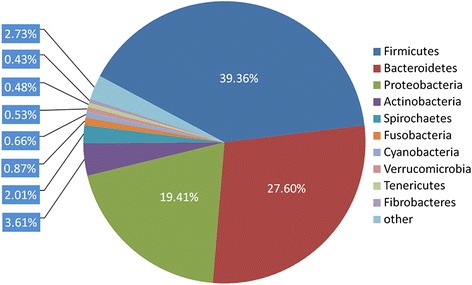
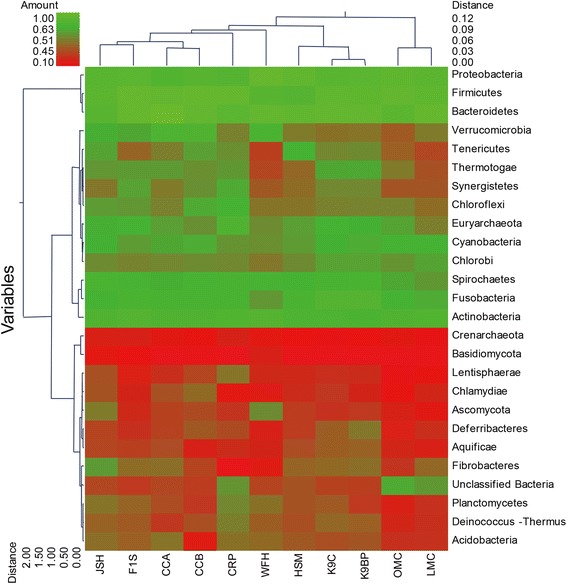
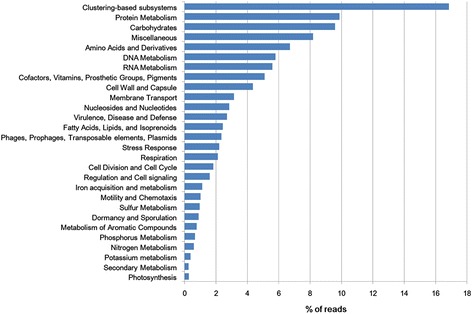
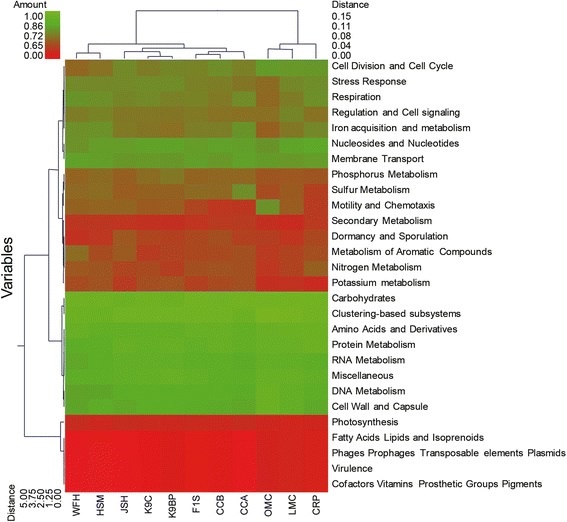
Results: In this study, an analysis of 97,942 pyrosequencing reads generated from Rhinopithecus bieti fecal DNA extracts was performed to help better understanding of the microbial diversity and functional capacity of the R. bieti gut microbiome. The taxonomic analysis of the metagenomic reads indicated that R. bieti fecal microbiomes were dominated by Firmicutes, Bacteroidetes, Proteobacteria and Actinobacteria phyla. The comparative analysis of taxonomic classification revealed that the metagenome of R. bieti was characterized by an overrepresentation of bacteria of phylum Fibrobacteres and Spirochaetes as compared with other animals. Primary functional categories were associated mainly with protein, carbohydrates, amino acids, DNA and RNA metabolism, cofactors, cell wall and capsule and membrane transport. Comparing glycoside hydrolase profiles of R. bieti with those of other animal revealed that the R. bieti microbiome was most closely related to cow rumen.

Conclusions: Metagenomic and functional analysis demonstrated that R. bieti possesses a broad diversity of bacteria and numerous glycoside hydrolases responsible for lignocellulosic biomass degradation which might reflect the adaptations associated with a diet rich in fibrous matter. These results would contribute to the limited body of NHPs metagenome studies and provide a unique genetic resource of plant cell wall degrading microbial enzymes. However, future studies on the metagenome sequencing of R. bieti regarding the effects of age, genetics, diet and environment on the composition and activity of the metagenomes are required.


Figures

Figure 1
Figure 1
Bacterial phylum profiles of the R. bieti microbiome. The percentage of the R. bieti fecal metagenomic sequences assigned to M5NR database is shown. Through the “Organism Abundance” tool in MG-RAST, the R. bieti fecal sequencing runs were determined from the M5NR database with the BLASTx algorithm. The e-value cutoff for the metagenomic sequence matches to the M5NR database was 1 × 10−5, with a minimum alignment length of 30 bp.
Figure 2
Figure 2
Phylogenetic clustering of R. bieti , pygmy loris, human, mouse, canine, cow, and chicken gastrointestinal metagenomes. A double hierarchical dendrogram was established through weight-pair group clustering methods based on the non-scaling Manhattan distance. The dendrogram shows the phylogenetic distribution of the microorganisms among the eleven metagenomes from the seven different hosts, including R. bieti (JSH), pygmy loris (WFH), human (HSM and F1S), mouse (LMC and OMC), dog (K9C and K9BP), cow (CRP), and chicken (CCA and CCB). The linkages of the dendrogram do not show the phylogenetic relationship of the bacterial phylum and are based on the relative abundance of taxonomic profiles. The heat map depicts the relative percentage of each phylum of microorganism (variables clustering on the y axis) in each sample (x axis clustering). The heat map color represents the relative percentage of the microbial descriptions in each sample, with the legend indicated at the upper left corner. Branch length indicates the Manhattan distances of the samples along the x axis (scale at the upper right corner) and of the microbial phyla along the y axis (scale at the lower left corner).
Figure 3
Figure 3
Functional composition of the R. bieti microbiome. The percentage of the R. bieti fecal metagenomic sequences assigned to the general SEED subsystems is shown. Through the “Functional Abundance” tool in MG-RAST, the R. bieti fecal sequencing runs were determined from the SEED database with the BLASTx algorithm. The e-value cutoff for the metagenomic sequence matches to the SEED subsystem database was 1 × 10−5 with a minimum alignment length of 30 bp.
Figure 4
Figure 4
Metabolic clustering of R. bieti , pygmy loris, human, mouse, canine, cow, and chicken gastrointestinal metagenomes. A double hierarchical dendrogram was established through a weight-pair group clustering method based on the non-scaling Manhattan distance. The dendrogram shows the distribution of the functional categories among the eleven metagenomes from the seven different hosts, including R. bieti (JSH), pygmy loris (WFH), humans (HSM and F1S), murine (LMC and OMC), canine (K9C and K9BP), cow (CRP), and chicken (CCA and CCB). The linkages of the dendrogram are based on the relative abundance of metabolic profiles. The heat map depicts the relative percentage of each category of function (variables clustering on the y axis) in each sample (x axis clustering). The heat map color represents the relative percentage of functional categories in each sample, with the legend indicated at the upper left corner. Branch length indicates the Manhattan distances of the samples along the x axis (scale at the upper right corner) and of the microbial classes along the y axis (scale at the lower left corner).

References

    1. Long YC, Kirkpatrick CR, Zhong T, Xiao L. Report on distribution, population and ecology of the Yunnan snub-nosed monkey (Rhinopithecus bieti) Primates. 1994;35:241–250. doi: 10.1007/BF02382060. - DOI
    1. Bennett EL, Davies AG. The ecology of Asian colobines. In: Davies AG, Oates JF, editors. Colobine monkeys: Their ecology, behaviour and evolution. Cambridge, UK: Cambridge University Press; 1994. pp. 129–171.
    1. Peng YZ, Zhang YP, Ye ZZ, Liu RL. Study on the stomachs in three species of snub-nosed monkeys. Zoonoses Res. 1983;4:167–175.
    1. Chen JJ, Lu T, Liu JS, Huang ZR. Observations on the stomach of Rhinopithecus Roxellanae. Acta Theriologica Sinica. 1995;15:176–180.
    1. Ley RE, Hamady M, Lozupone C, Turnbaugh PJ, Ramey RR, Bircher JS, et al. Evolution of mammals and their gut microbes. Science. 2008;320:1647–1651. doi: 10.1126/science.1155725. - DOI - PMC - PubMed

Publication types

MeSH terms

LinkOut - more resources