. 2015 Mar 28:15:74.
doi: 10.1186/s12866-015-0415-7.

Neutral lipid alterations in human herpesvirus 8-infected HUVEC cells and their possible involvement in neo-angiogenesis

Affiliations

Neutral lipid alterations in human herpesvirus 8-infected HUVEC cells and their possible involvement in neo-angiogenesis

Fabrizio Angius et al. BMC Microbiol. .

Abstract

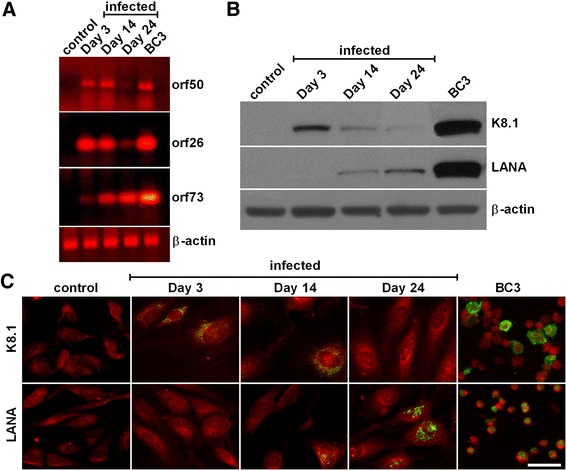
Background: Human Herpesvirus 8 (HHV8), the causative agent of Kaposi's sarcoma, induces an intense modification of lipid metabolism and enhances the angiogenic process in endothelial cells. In the present study, neutral lipid (NL) metabolism and angiogenesis were investigated in HHV8-infected HUVEC cells. The viral replication phases were verified by rtPCR and also by K8.1 and LANA immunostaining.

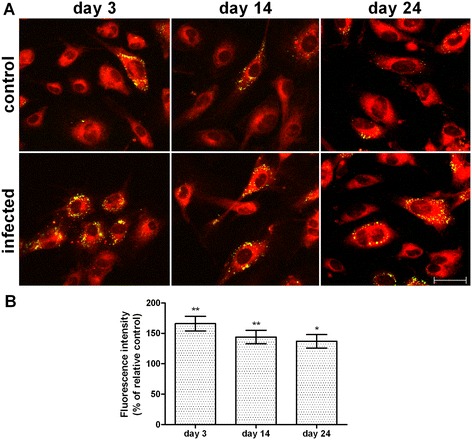
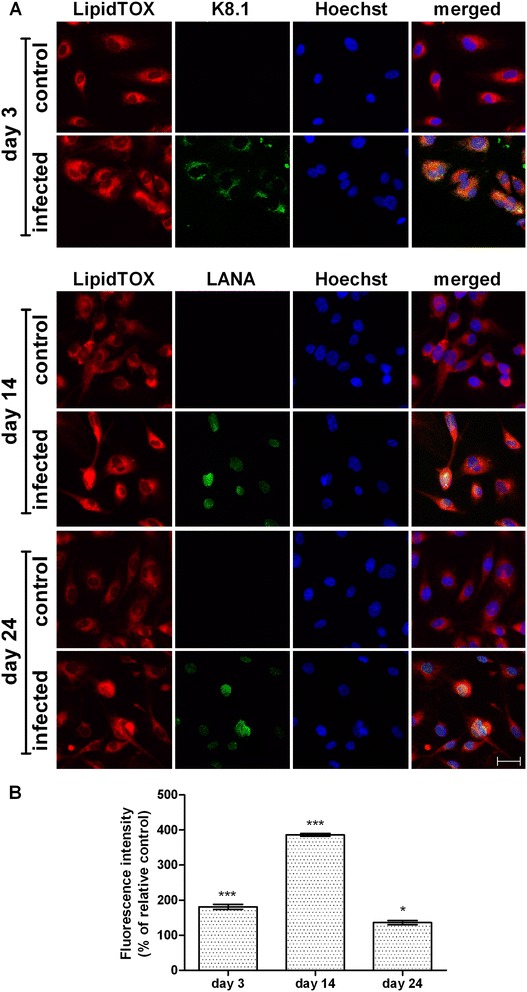
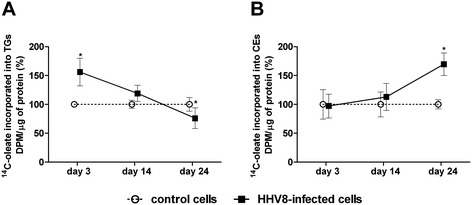
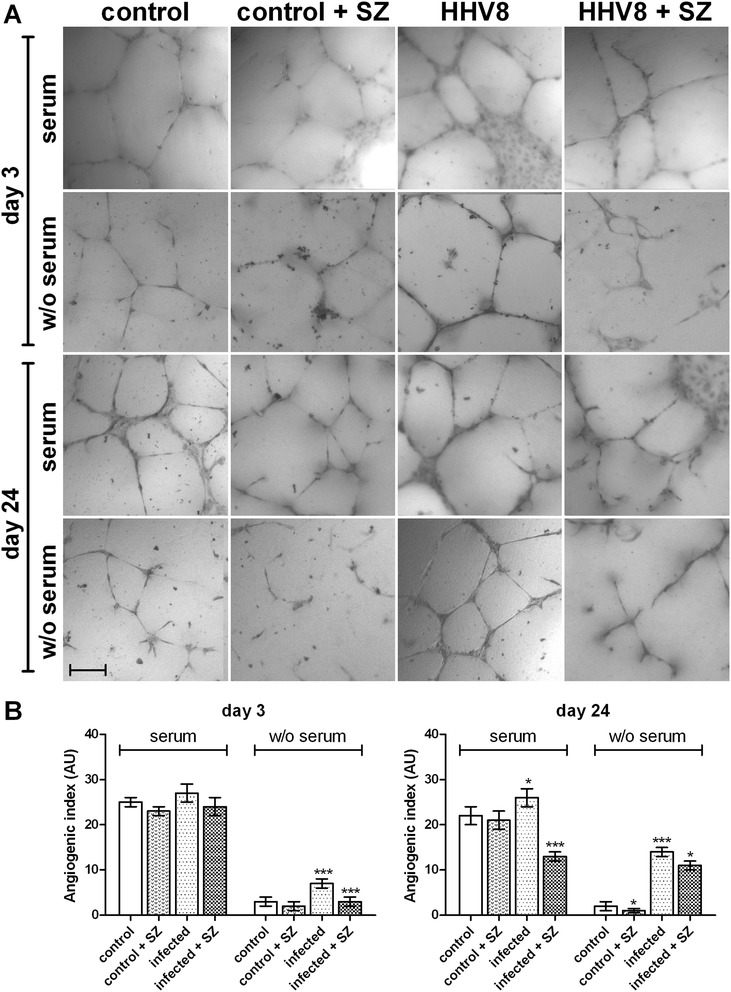
Results: Lipid droplets (Nile Red) were higher in all phases and NL staining (LipidTOX) combined with viral-antigen detection (immunofluorescence) demonstrated a NL content increase in infected cells. In particular, triglyceride synthesis increases in the lytic phase, whereas cholesteryl ester synthesis rises in the latent one. Moreover, the inhibition of cholesterol esterification reduces neo-tubule formation mainly in latently infected cells.

Conclusions: We suggest that a reprogramming of cholesteryl ester metabolism is involved in regulating neo-angiogenesis in HHV8-infected cells and plays a likely role in the high metastatic potential of derived-tumours.


Figures

Figure 1
Figure 1
Characterization of lytic and latent phases during long term HHV8 infection of HUVEC cells. HUVEC cells were infected with HHV8, concentrated at a multiplicity of at least 10-20 genomes per cell in a M200 medium containing 2 μg/ml of polybrene for 2 h at 37°C. Panel A: On days 3, 14 and 24 post infection, 1.0 × 10⁶ cells were harvested and RNA-extracted for detection of lytic (orf26 and orf50) and latent (orf73) viral genes by RT-PCR. HHV8-infected BC3 cells were used as a positive control. The housekeeping β-actin gene was used as a control (for details see Methods). Panel B: At the indicated times (3, 14 and 24 days post infection) sub-confluent cells were harvested and processed as required for western blotting (for details see Methods). Panel C: 24 h before the indicated times (3, 14 and 24 days post infection), cells were seeded at a density of 2.0 × 10⁵ in 35 mm glass-bottomed dishes and cultured at 37°C in a 5% CO2 incubator in a growth medium. Thereafter, cells were washed and fixed for the immunofluorescence detection of lytic (K8.1) and latent (LANA) viral-antigens (green) as reported in Methods. The bar in the figure is 30 μm.
Figure 2
Figure 2
Neutral lipid content in lipid droplets in HHV8-infected HUVEC cells. HUVEC cells were infected with HHV8 as described in Figure 1. 24 h before the indicated times, cells were seeded at a density of 2.0 × 10⁵ in 35 mm glass-bottomed dishes and cultured at 37°C in a 5% CO2 incubator in a growth medium. On days 3, 14 and 24 post infection, cells were fixed and stained with Nile Red (for details see Methods), reported as green/yellow dots in the figure (panel A). The bar in the figure is 30 μm. Panel B represents the quantitative analysis of Nile Red green fluorescence intensity. At least 200 cells were individually selected and analyzed for each experimental group. Normalized data represent the percentage of the mean density value (intensity per pixel) ± standard error (SE). Significance was set up when p < 0.05 (*) or p < 0.01(**) vs. respective control (ANOVA and Fischer’s LSD as post hoc test).
Figure 3
Figure 3
Neutral lipid detection and quantification in HHV8-infected HUVEC cells by LipidTOX dye. HUVEC cells were infected with HHV8 as described in Figure 1. 24 h before the indicated times, cells were seeded at a density of 2.0 × 10⁵ in 35 mm glass-bottomed dishes and cultured at 37°C in a 5% CO2 incubator in a growth medium. On days 3, 14 and 24 post infection, cells were fixed and treble-stained with firstly HCS LipidTOX™ Red Neutral Lipid stain (red), followed by an immunocytofluorescence method for identifying lytic (K8.1) and latent (LANA) viral-antigens with FITC-conjugated secondary antibodies (green) in the same cells counterstained with Hoechst 33258 for nuclei (blue), for details see Methods (panel A). The bar in the figure is 30 μm. Panel B represents the quantitative analysis of HCS LipidTOX™ Red Neutral Lipid stain fluorescence intensity. This method allowed the quantification of the neutral lipids in LDs in HHV8-infected cells alone. At least 10 microscopic fields were individually analysed for each experimental group. Normalized data represent the percentage of the mean density value (intensity per pixel) ± SE. Significance was set up when p < 0.05 (*) or p < 0.001 (***) vs. respective control (ANOVA and Fischer’s LSD as post hoc test).
Figure 4
Figure 4
TG and CE synthesis in HHV8-infected and control HUVEC cells. HUVEC cells were infected with HHV8 as described in Figure 1. On days 3, 14 and 24 post infection, 1.0 × 10⁶ cells were incubated for 4 h in a medium containing [14C]-oleate bound to bovine serum albumin (BSA). Subsequently, cells were washed with ice-cold PBS and lipids extracted with acetone. Neutral lipids were separated by thin layer chromatography (TLC), and the incorporation of [14C]-oleate into TGs (panel A) and CEs (panel B) was determined as described in Methods. Data were reported as mean ± SE. Significance was set up when p < 0.05 (*) vs. respective control (t-test).
Figure 5
Figure 5
Capillary-like vascular micro-tubule formation in HHV8-infected and control HUVEC cells. HUVEC cells were infected with HHV8 as described in Figure 1. 24 h before the indicated times, 3.0 × 10⁴ cells were seeded in plates previously coated with Geltrex matrix and cultured in a complete or serum-free M200 medium in a CO2 incubator at 37°C. The specific ACAT inhibitor Sandoz 58035 (SZ, 4 μM) was added in some experimental groups. Capillary-like microtubule formation in the control and HHV8-infected HUVEC cells was performed as described in the Methods section. Panel A shows the light microscope images of micro-tubule formation in control, lytic and latent HHV8-infected HUVEC cells cultured in medium with or without (W/O) fetal calf serum (FCS). The bar in the figure is 240 μm. Panel B represents the angiogenic index quantification (for details, see Methods). All the samples were prepared in triplicate and the experiments were repeated at least twice. Data were reported as mean ± SE. Significance was set up when p < 0.05 (*) or p < 0.001 (***) vs. respective control (t-test).

References

    1. Ablashi DV, Chatlynne LG, Whitman JE, Jr, Cesarman E. Spectrum of Kaposi's sarcoma-associated herpesvirus, or human herpesvirus 8, diseases. Clin Microbiol Rev. 2002;15(3):439–464. doi: 10.1128/CMR.15.3.439-464.2002. - DOI - PMC - PubMed
    1. Dourmishev LA, Dourmishev AL, Palmeri D, Schwartz RA, Lukac DM. Molecular genetics of Kaposi's sarcoma-associated herpesvirus (human herpesvirus-8) epidemiology and pathogenesis. Microbiol Mol Biol Rev. 2003;67(2):175–212. doi: 10.1128/MMBR.67.2.175-212.2003. - DOI - PMC - PubMed
    1. Ganem D. KSHV and the pathogenesis of Kaposi sarcoma: listening to human biology and medicine. J Clin Invest. 2010;120(4):939–949. doi: 10.1172/JCI40567. - DOI - PMC - PubMed
    1. Hengge UR, Ruzicka T, Tyring SK, Stuschke M, Roggendorf M, Schwartz RA, et al. Update on Kaposi's sarcoma and other HHV8 associated diseases. Part 1: epidemiology, environmental predispositions, clinical manifestations, and therapy. Lancet Infect Dis. 2002;2(5):281–292. doi: 10.1016/S1473-3099(02)00263-3. - DOI - PubMed
    1. Wen KW, Damania B. Kaposi sarcoma-associated herpesvirus (KSHV): molecular biology and oncogenesis. Cancer Lett. 2010;289(2):140–150. doi: 10.1016/j.canlet.2009.07.004. - DOI - PMC - PubMed

Publication types

MeSH terms

LinkOut - more resources