. 2015 May 28;125(22):3466-76.
doi: 10.1182/blood-2014-11-612721. Epub 2015 Apr 17.

Targeting of folate receptor β on acute myeloid leukemia blasts with chimeric antigen receptor-expressing T cells

Affiliations

Targeting of folate receptor β on acute myeloid leukemia blasts with chimeric antigen receptor-expressing T cells

Rachel C Lynn et al. Blood. .

Abstract

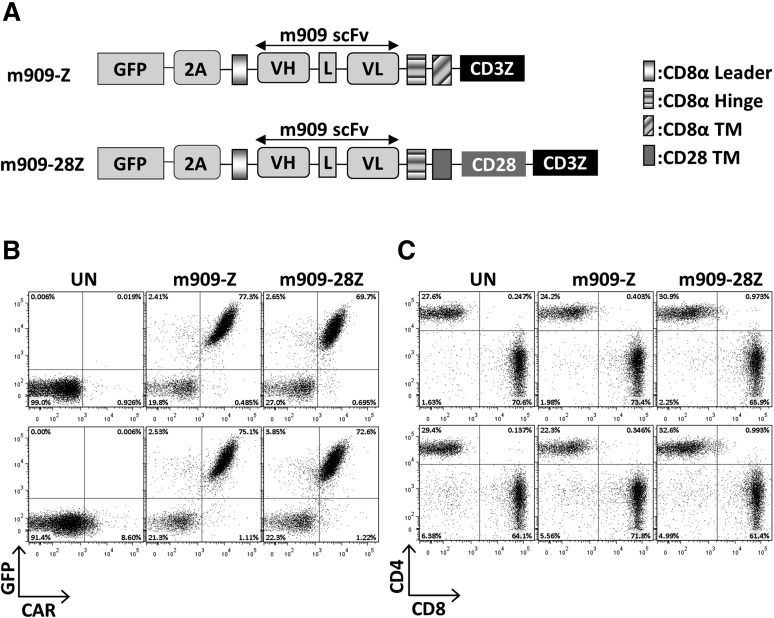
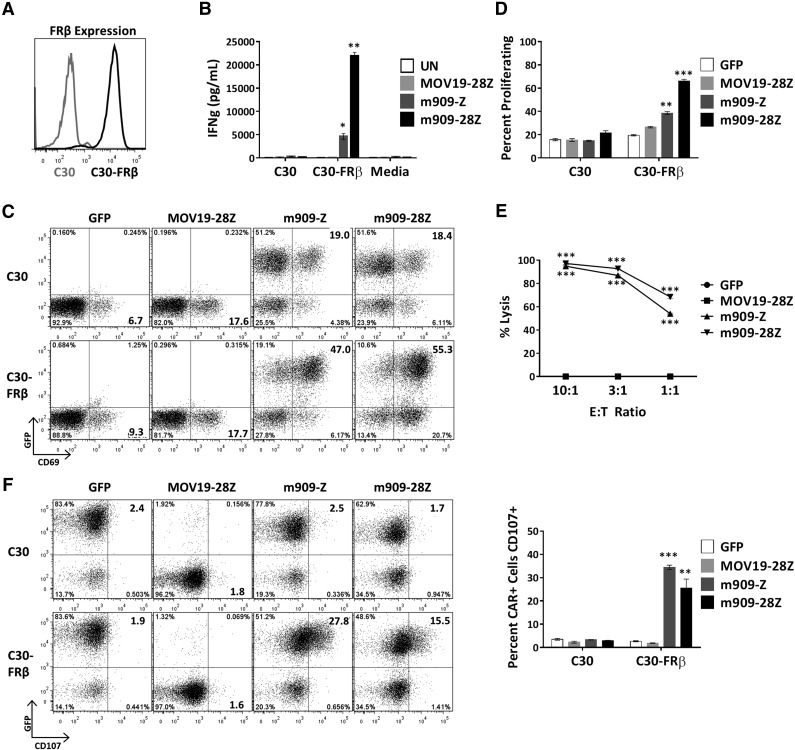
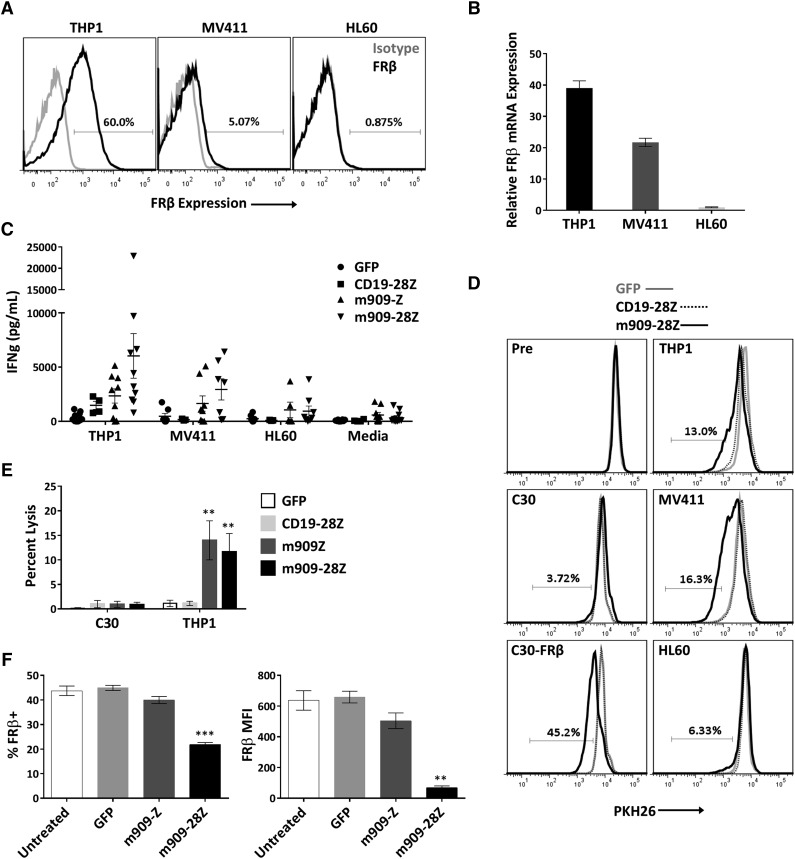
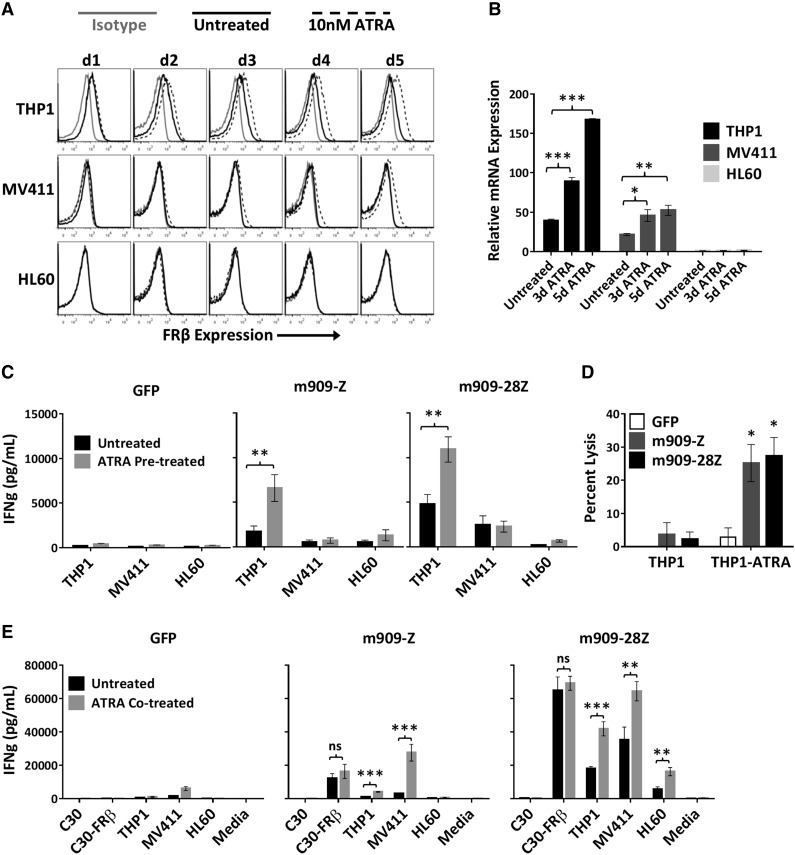
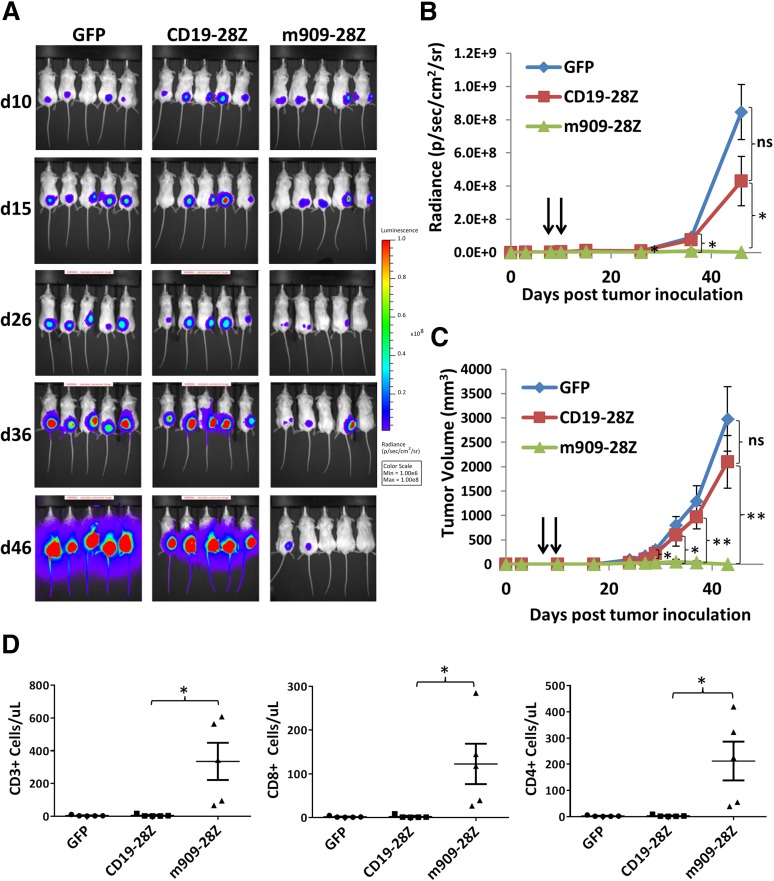
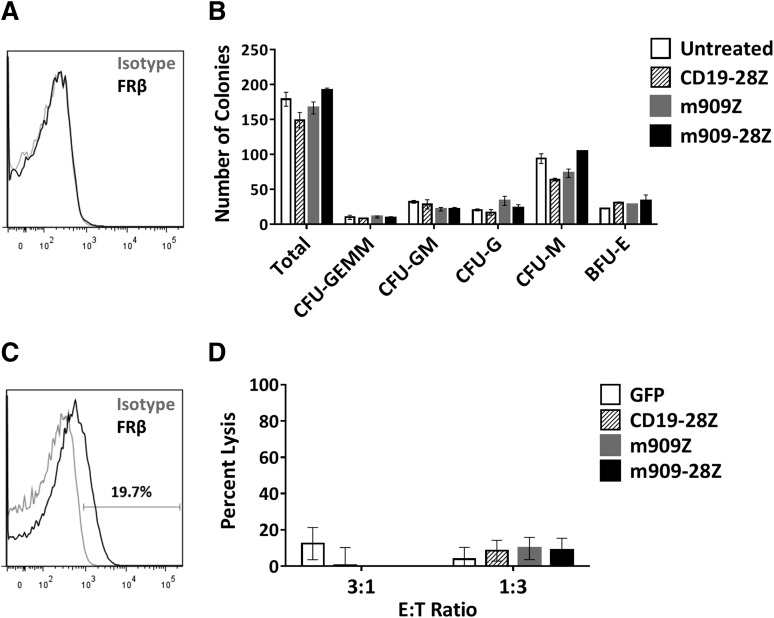
T cells expressing a chimeric antigen receptor (CAR) can produce dramatic results in lymphocytic leukemia patients; however, therapeutic strategies for myeloid leukemia remain limited. Folate receptor β (FRβ) is a myeloid-lineage antigen expressed on 70% of acute myeloid leukemia (AML) patient samples. Here, we describe the development and evaluation of the first CARs specific for human FRβ (m909) in vitro and in vivo. m909 CAR T cells exhibited selective activation and lytic function against engineered C30-FRβ as well as endogenous FRβ(+) AML cell lines in vitro. In mouse models of human AML, m909 CAR T cells mediated the regression of engrafted FRβ(+) THP1 AML in vivo. In addition, we demonstrated that treatment of AML with all-trans retinoic acid (ATRA) enhanced FRβ expression, resulting in improved immune recognition by m909 CAR T cells. Because many cell surface markers are shared between AML blasts and healthy hematopoietic stem and progenitor cells (HSCs), we evaluated FRβ expression and recognition of HSCs by CAR T cells. m909 CAR T cells were not toxic against healthy human CD34(+) HSCs in vitro. Our results indicate that FRβ is a promising target for CAR T-cell therapy of AML, which may be augmented by combination with ATRA.


Figures

Figure 1
Figure 1
FRβ CAR construction and expression in primary human T cells. (A) Schematic of lentiviral CAR expression vectors containing the anti-human FRβ scFv m909 linked to either intracellular signaling domains from CD3-ζ alone (m909-Z) or CD28 and CD3-ζ in tandem (m909-28Z). Both constructs also encode GFP separated by a viral T2A (2A) ribosomal skipping peptide. (B) CAR expression in primary human T cells. Expression of m909 CAR in primary human T cells was confirmed by GFP, and surface expression was confirmed by labeling with a rabbit anti-human IgG antibody that binds the human m909 scFv portion of the CAR. Upper and lower rows show results from 2 representative donors. (C) After 13 days of expansion, m909 CAR–transduced T-cell populations comprise ∼70% CD8+ and 30% CD4+. Upper and lower rows show results from 2 representative donors. L, linker; TM, transmembrane domain; UN, untransduced T cells; VH, variable heavy chain; VL, variable light chain.
Figure 2
Figure 2
m909 CAR T cells are reactive against cell surface FRβ on engineered C30-FRβ cell line. To first test the functionality of m909 CARs, the antigen-negative ovarian cancer cell line C30 was transduced to stably overexpress human FRβ cDNA. Cocultures were performed at an E:T ratio of 1:1 unless otherwise noted. Control MOV19-28Z CAR T cells are specific for FRα and do not express GFP. Control GFP T cells express only GFP. Error bars represent mean ± SEM. (A) FRβ expression on engineered C30-FRβ was detected by flow cytometry using biotinylated m909-IgG (black histogram). For comparison, the unmodified parental C30 cells were used as a control (gray histogram). (B) Antigen-specific IFN-γ (IFNg) production by m909 CAR T cells as detected by ELISA from 24-hour coculture supernatants. (C) m909 CAR+ T cells upregulate surface CD69 expression following 24-hour exposure to C30-FRβ. The m909 CAR+ cells are identified by GFP expression (y-axis). (D) m909-Z and m909-28Z CAR T cells proliferate in response to C30-FRβ. PKH26 dilution in labeled T cells was measured by flow cytometry after 5 days in coculture. Percentage of CD3+ cells proliferating (diluted PKH26 compared to day 0) is quantified. P values represent significant differences compared to MOV19-28Z CAR T cells. (E) m909-Z and m909-28Z exhibit specific lysis of C30-FRβ. Target cells were transduced to express fLuc and cocultured with CAR T cells at E:T ratios of 10:1, 3:1, and 1:1. Residual luciferase signal was determined after 18 hours. Percent lysis was determined by luminescence comparison with untreated target wells. (F) m909-Z and m909-28Z exhibit degranulation on coculture with C30-FRβ. CD107a/b surface expression was measured after 5 hours of coculture. CAR+ cells are identified by GFP expression (y-axis). Percentage of CAR+ cells with positive staining for CD107a/b is quantified to the right. P values represent significant increases compared to MOV19-28Z control T cells. *P < .05; **P < .01; ***P < .001.
Figure 3
Figure 3
m909-28Z CAR T cells are reactive against endogenous FRβ on human AML cell lines in vitro. To test m909 CAR T-cell reactivity against clinically relevant targets, we acquired 3 human AML cell lines with varying levels of FRβ expression. Cocultures were performed at an E:T ratio of 1:1 unless otherwise noted. Control CD19-28Z CAR T cells are specific for human CD19 and do not express GFP. In media controls, T cells were plated without target cells. Error bars represent mean ± SEM. (A) Surface expression of FRβ on AML cell lines THP1, MV411, and HL60 was determined by flow cytometry using m909-IgG (black) and human IgG isotype control (gray). Percentages represent the proportion of cells with a positive fluorescence signal compared to isotype. (B) Relative FRβ mRNA expression was confirmed using quantitative RT-PCR. Indicated mRNA expression is shown relative to HL60. (C) Antigen-specific IFN-γ (IFNg) secretion was quantified by ELISA after overnight coculture. Each data point represents the mean value of triplicate wells from independent experiments. Represented are n = 10 different normal T-cell donors. (D) m909-28Z CAR T cells proliferate in response to THP1 and MV411, but not HL60, compared to control T cells. PKH26 dilution was measured via flow cytometry before (Pre) and after 5 days in coculture. Overlaying histograms display day-5 PKH26 fluorescence in GFP (gray line), CD19-28Z (dotted black line), and m909-28Z (solid black line) T-cell cocultures with the indicated cell targets. A live, CD3+ gate was used. Percentages represent the proportion of m909-28Z T cells with diluted PKH26 compared to CD19-28Z CAR T cells. (E) m909 CAR T cells exhibit specific lysis of THP1. Luciferase-expressing target cells were cocultured with CAR T cells at an E:T ratio of 1:1. Residual luciferase signal was determined after 24 hours. Percent lysis was determined by luminescence comparison with untreated target wells. Data shown are mean ± SEM of n = 9 independent T-cell donors. P values are calculated compared to CD19-28Z control treated wells. (F) Decreased FRβ expression on THP1 cells surviving overnight coculture with m909 CAR T cells. FRβ surface expression was determined by flow cytometry using m909-IgG and human IgG isotype control. A live, CD3 gate was used to distinguish surviving THP1 cells. The percent of cells showing positive FRβ staining compared to isotype (left) and the FRβ median fluorescence intensity (MFI; right) were determined for triplicate wells (n = 3). P values were determined compared to control GFP T cell–treated wells. **P < .01; ***P < .001.
Figure 4
Figure 4
ATRA increases FRβ expression and m909 CAR T-cell recognition of AML cell lines. (A) AML cell lines were treated with (dotted black line) and without (solid black line) 10 nM ATRA for 5 days (d1-d5). Surface FRβ expression was determined each day by flow cytometry with m909-IgG (black) or human IgG isotype control (gray). (B) FRβ mRNA expression was determined before (untreated) and after 3 days and 5 days of 10 nM ATRA treatment. Relative mRNA is shown compared to untreated HL60. Bars represent mean ± SEM of n = 5 replicate wells. P values were calculated for each cell line compared to untreated controls. (C) m909 CAR T cells secrete higher IFN-γ (IFNg) in response to THP1 cells pretreated for 5 days with 10 nM ATRA (gray bars) compared to untreated cells (black bars) in overnight cocultures. (D) THP1-fLuc cells were pretreated with (THP1-ATRA) or without (THP1) 10 nM ATRA for 5 days before coculture with m909 CAR or GFP control T cells at an E:T ratio of 1:1. Percent lysis was determined by residual luciferase activity after overnight coculture. (E) m909 CAR T cells secrete higher IFN-γ after 3 days of coculture in the presence of 10 nM ATRA (gray bars) and AML target cell lines compared to cultures without ATRA (black bars). No significant differences in IFN-γ secretion were observed for m909 T cells activated in the presence of C30-FRβ with or without ATRA. In panels C-E, graphs represent mean ± SEM from n = 3 independent experiments using 3 distinct T-cell donors. P values were calculated for each T-cell subset to compare between untreated and ATRA-treated cell lines. *P < .05; **P < .01; ***P < .001. ns, P > .05.
Figure 5
Figure 5
m909-28Z CAR T cells prevent THP1 AML tumor growth in vivo. THP1-fLuc cells (5 × 10⁶) were injected into (NOD/SCID)/γ-chain−/− mice subcutaneously on day (d)0. CAR+ T cells (5 × 10⁶) were given intraperitoneally on days 8 and 10. Tumor growth was monitored by luminescence (A-B) and by caliper measurement (C). Graphs represent mean ± SEM of n = 5 mice per experiment. P values were calculated compared to CD19-28Z–treated control mice. Differences between GFP and CD19-28Z groups did not reach statistical significance at any time point. (D) Preferential expansion and survival of peripheral human T cells in m909-28Z–treated mice compared to control T cells. Peripheral blood was collected on day 38 (4 weeks post–T-cell injection), and absolute numbers of human CD3+ (left), CD8+ (middle), and CD4+ (right) T cells were quantified by flow cytometry and are reported in total cells per microliter of blood. *P < .05; **P < .01. ns, P > .05.
Figure 6
Figure 6
m909 CAR T cells do not inhibit CD34+ HSC colony formation or eliminate FRβ-low healthy monocytes in vitro. (A) After healthy adult human bone marrow CD34+ HSCs were isolated, they were stained for FRβ expression using m909-IgG (black) or human IgG isotype control (gray). One representative donor is shown. (B) Isolated CD34+ HSCs were cocultured with CAR T cells at an E:T ratio of 1:1 for 4 hours. Wells were diluted in methylcellulose and cultured for 14 days. Total colonies were counted and scored for CFU-GEMM, CFU-GM, CFU-G, CFU-M, and BFU-E. There were no significant differences between total or lineage-specific colonies for any of the treated groups compared to untreated CD34+ HSCs. Bar graphs represent mean + standard deviation for n = 2 wells per condition. Results are representative of 4 independent experiments and 3 normal bone marrow donors. (C) Low surface expression of FRβ on normal human monocytes detected by flow cytometry using m909-IgG (black) or human IgG isotype control (gray). One representative of 7 normal donors is shown. (D) CD14+ human monocytes were cocultured with indicated engineered T cells at E:T ratios of 3:1 and 1:3 for 4 hours, after which the total number of live CD3, CD14+ monocytes per well was quantified by bead-based flow cytometry. Data incorporates results using 3 different CAR T-cell donors and 4 different monocyte donors as target cells. BFU-E, erythroid blast forming unit; G, granulocyte; GEMM, granulocyte/erythrocyte/monocyte/megakaryocyte; GM, granulocyte/monocyte; M, monocyte.

References

    1. Roboz GJ. Current treatment of acute myeloid leukemia. Curr Opin Oncol. 2012;24(6):711–719. - PubMed
    1. Gross G, Waks T, Eshhar Z. Expression of immunoglobulin-T-cell receptor chimeric molecules as functional receptors with antibody-type specificity. Proc Natl Acad Sci USA. 1989;86(24):10024–10028. - PMC - PubMed
    1. Porter DL, Levine BL, Kalos M, Bagg A, June CH. Chimeric antigen receptor-modified T cells in chronic lymphoid leukemia. N Engl J Med. 2011;365(8):725–733. - PMC - PubMed
    1. Brentjens RJ, Rivière I, Park JH, et al. Safety and persistence of adoptively transferred autologous CD19-targeted T cells in patients with relapsed or chemotherapy refractory B-cell leukemias. Blood. 2011;118(18):4817–4828. - PMC - PubMed
    1. Kochenderfer JN, Dudley ME, Feldman SA, et al. B-cell depletion and remissions of malignancy along with cytokine-associated toxicity in a clinical trial of anti-CD19 chimeric-antigen-receptor-transduced T cells. Blood. 2012;119(12):2709–2720. - PMC - PubMed

Publication types

MeSH terms