. 2015 Mar 12:10:9.
doi: 10.1186/s13024-015-0005-z.

An automated image analysis method to measure regularity in biological patterns: a case study in a Drosophila neurodegenerative model

Affiliations

An automated image analysis method to measure regularity in biological patterns: a case study in a Drosophila neurodegenerative model

Sergio Diez-Hermano et al. Mol Neurodegener. .

Abstract

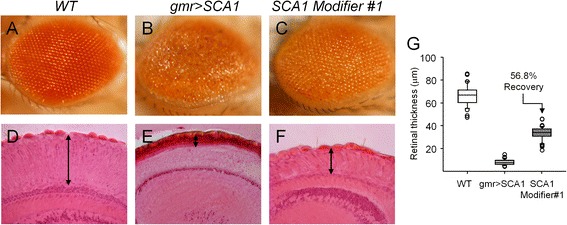
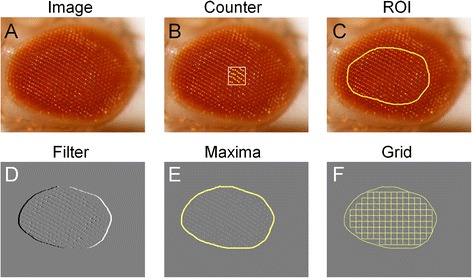
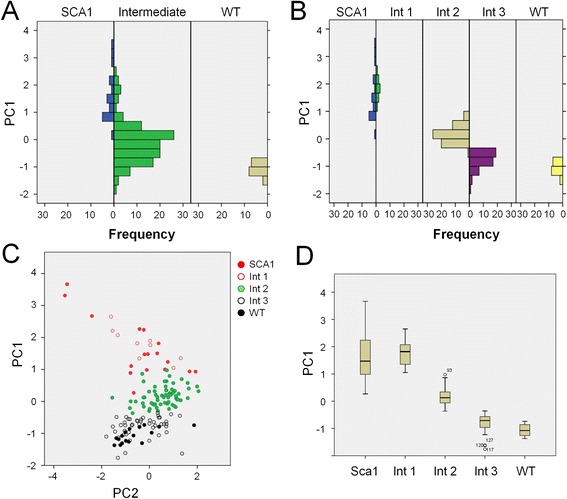
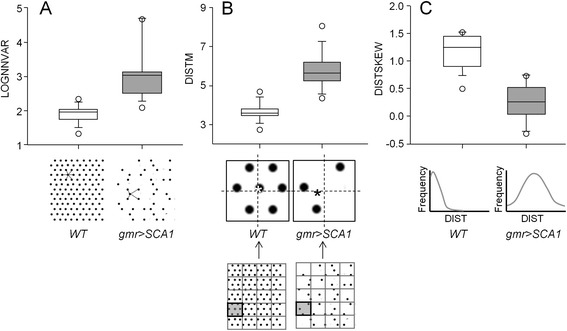
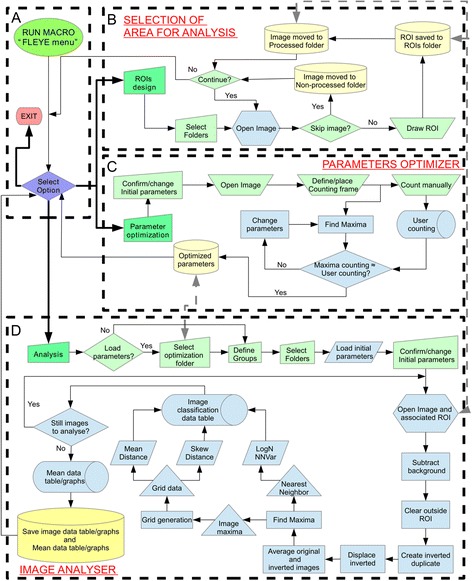
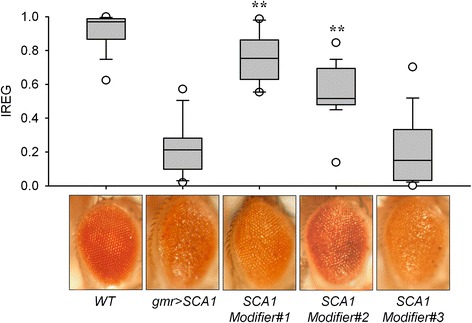
The fruitfly compound eye has been broadly used as a model for neurodegenerative diseases. Classical quantitative techniques to estimate the degeneration level of an eye under certain experimental conditions rely either on time consuming histological techniques to measure retinal thickness, or pseudopupil visualization and manual counting. Alternatively, visual examination of the eye surface appearance gives only a qualitative approximation provided the observer is well-trained. Therefore, there is a need for a simplified and standardized analysis of fruitfly eye degeneration extent for both routine laboratory use and for automated high-throughput analysis. We have designed the freely available ImageJ plugin FLEYE, a novel and user-friendly method for quantitative unbiased evaluation of neurodegeneration levels based on the acquisition of fly eye surface pictures. The incorporation of automated image analysis tools and a classification algorithm sustained on a built-in statistical model allow the user to quickly analyze large sample size data with reliability and robustness. Pharmacological screenings or genetic studies using the Drosophila retina as a model system may benefit from our method, because it can be easily implemented in a fully automated environment. In addition, FLEYE can be trained to optimize the image detection capabilities, resulting in a versatile approach to evaluate the pattern regularity of other biological or non-biological samples and their experimental or pathological disruption.


Figures

Figure 1
Figure 1
Histological method to analyze Drosophila eye degeneration phenotypes. External pictures of fly eyes surface (A-C) and histological measurement of retinal thickness (D-F). Images in a column correspond to the same genotype. (G) Retinal thickness quantification in μm, resulting in a significant recovery from the degenerated genotype for the gmr > SCA1 Modifier#1 (n = 34-46 sections/genotype).
Figure 2
Figure 2
Representation of image processing steps performed by FLEYE plugin. Starting with eye surface images (A) a “training step” is performed where the plugin detection is fitted to the number of user-counted ommatidia in WT eyes (B). Then, the user defines a region of interest (ROI) (C). An averaging step (Filter) normalizes the picture (D) and pixel maxima are identified (E). A squared grid is applied to the single-pixel maxima image (F). The final variables are obtained either globally from the distance between maxima or locally from spatial information of the pixel distribution in every cell of the grid.
Figure 3
Figure 3
Principal component analysis used to generate FLEYE built-in statistical model. (A) The first component of a PCA analysis performed with 9 variables discriminates between WT and SCA1 degenerated eyes and shows a polymodal distribution of intermediates. (B) The first PCA factor splits the sample into five different categories, 0 to 4, ranging from a healthy eye (class 0) to a totally degenerated eye (class 4). The classification remains the same even after removing 4 redundant variables among the 9 used (not shown). (C) The first PCA component explains 60% of the total variance and constitutes a clearly discriminating tool (D), whilst the second component explains 20% of the variance, but does not differentiate between healthy and degenerated samples.
Figure 4
Figure 4
Behavior of the three variables accounting for the predictive value of FLEYE statistical model. Values of the three statistical model variables obtained in healthy (WT) and degenerated (gmr > SCA1) fly eye samples (n = 35/genotype). (A) LOGNNVAR variable operates over the whole ROI (grid-cell independent). The nearest neighbor distances are expected to be more similar to each other in a WT eye than in a degenerated one, which has lost regularity and hence distances display a higher variance. (B) The variable DISTM for a grid cell (a representative pair is enlarged and shown in gray in the grid) is calculated as the mean difference between the centroid (the center point of the cell, marked as the intersection of dashed lines) and the maxima center of mass (the brightness-weighted average of the x and y coordinates of all pixels in the image or selection, marked with asterisks). A WT eye is expected to have a more regular distribution of maxima in a cell than a degenerated one, thus resulting in a mass center value closer to the centroid (lower difference output). (C) The variable DISTSKEW for a grid cell represents an asymmetry measure of the distance between the centroid and mass center (third spatial moment). As low values of DIST are more frequent in WT, a right-tailed distribution is expected, resulting in a positive skew value.
Figure 5
Figure 5
IREG robustness test. Mean IREG values obtained using three different training sets for WT, gmr > SCA1 and gmr > SCA1 Modifier#1. The robustness of the procedure is demonstrated due to the negligible changes in the computed values among trials.
Figure 6
Figure 6
FLEYE plugin algorithm flow chart. Four different macros and the interaction between them are displayed. (A) Main hub to access any of the actual computing macros. (B) ROI processing and storage. (C) Automated analysis parameters optimization (D) Variable data acquisition and final IREG calculation.
Figure 7
Figure 7
FLEYE method validation. IREG value distribution in a sample of fly eyes (n = 85, ≥ 15/genotype). Healthy (WT) and degenerated (gmr > SCA1) eyes are shown alongside three SCA1 Modifiers. Representative pictures of the eye surface for every genotype are displayed below each box. Statistical significant differences (**) were found between degenerated gmr > SCA1 eyes and the Modifiers #1 and #2, indicating significant phenotypic recovery of the regularity of their eye surface pattern. Statistical significance between experimental classes was assessed by Kruskal-Wallis test and Dunn’s post-hoc tests with p <0.01.

References

    1. Jaiswal M, Sandoval H, Zhang K, Bayat V, Bellen HJ. Probing mechanisms that underlie human neurodegenerative diseases in Drosophila. Annu Rev Genet. 2012;46:371–96. doi: 10.1146/annurev-genet-110711-155456. - DOI - PMC - PubMed
    1. Lenz S, Karsten P, Schulz JB, Voigt A. Drosophila as a screening tool to study human neurodegenerative diseases. J Neurochem. 2013;127:453–60. doi: 10.1111/jnc.12446. - DOI - PubMed
    1. Ambegaokar SS, Roy B, Jackson GR. Neurodegenerative models in Drosophila: polyglutamine disorders, Parkinson disease, and amyotrophic lateral sclerosis. Neurobiol Dis. 2010;40:29–39. doi: 10.1016/j.nbd.2010.05.026. - DOI - PMC - PubMed
    1. Green EW, Giorgini F. Choosing and using Drosophila models to characterize modifiers of Huntington’s disease. Biochem Soc Trans. 2012;40:739–45. doi: 10.1042/BST20120072. - DOI - PubMed
    1. Yu Z, Bonini NM. Modeling human trinucleotide repeat diseases in Drosophila. Int Rev Neurobiol. 2011;99:191–212. doi: 10.1016/B978-0-12-387003-2.00008-2. - DOI - PubMed