. 2015 Apr;27(4):1332-51.
doi: 10.1105/tpc.114.131086. Epub 2015 Apr 17.

A Secreted Effector Protein of Ustilago maydis Guides Maize Leaf Cells to Form Tumors

Affiliations

A Secreted Effector Protein of Ustilago maydis Guides Maize Leaf Cells to Form Tumors

Amey Redkar et al. Plant Cell. 2015 Apr.

Abstract

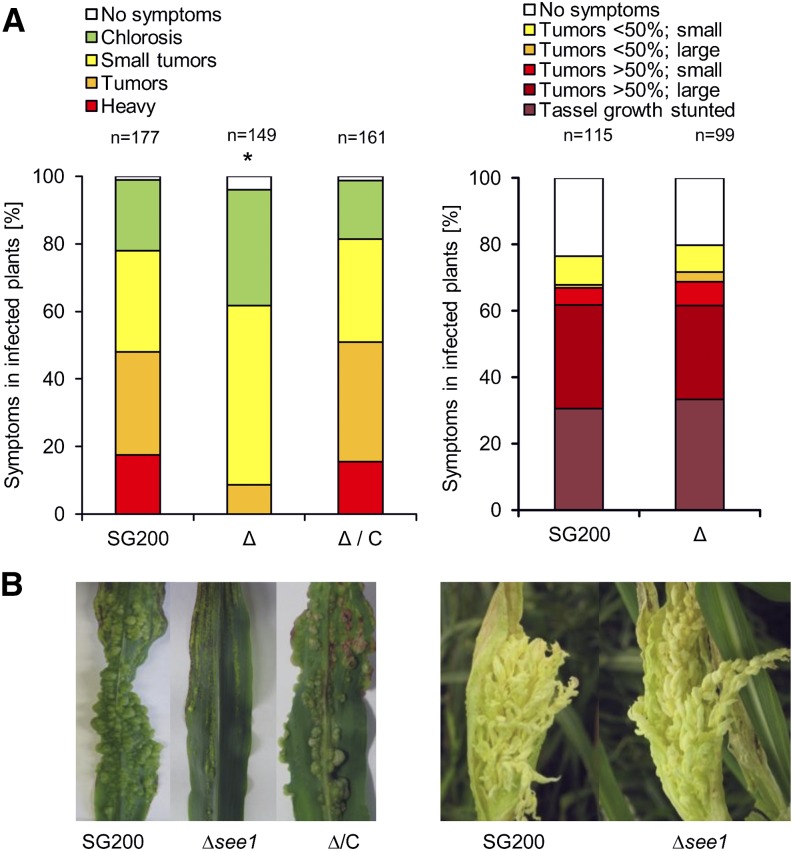
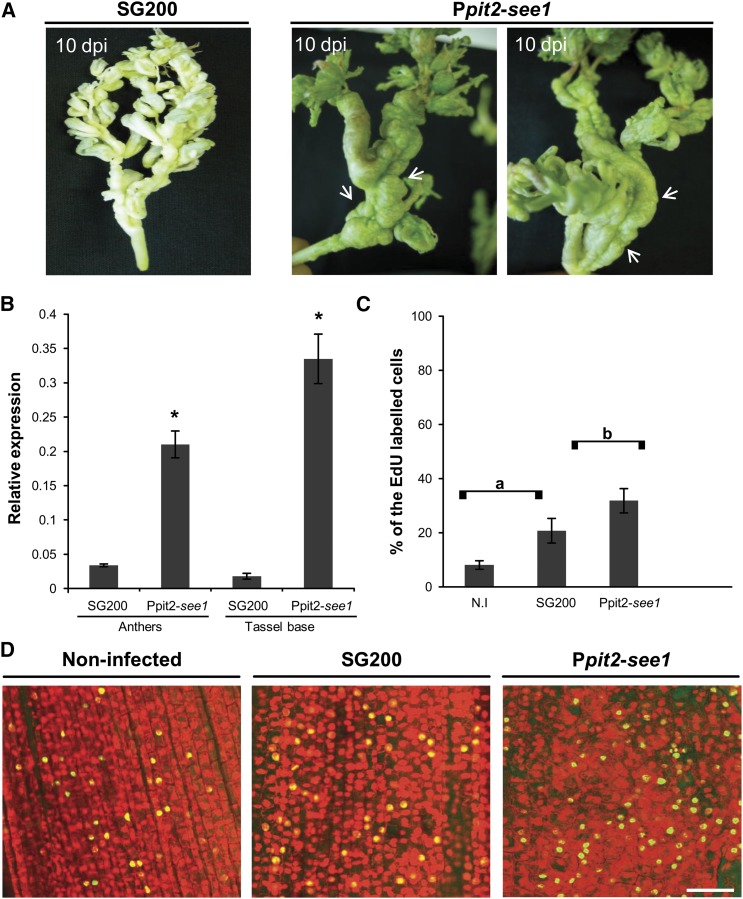
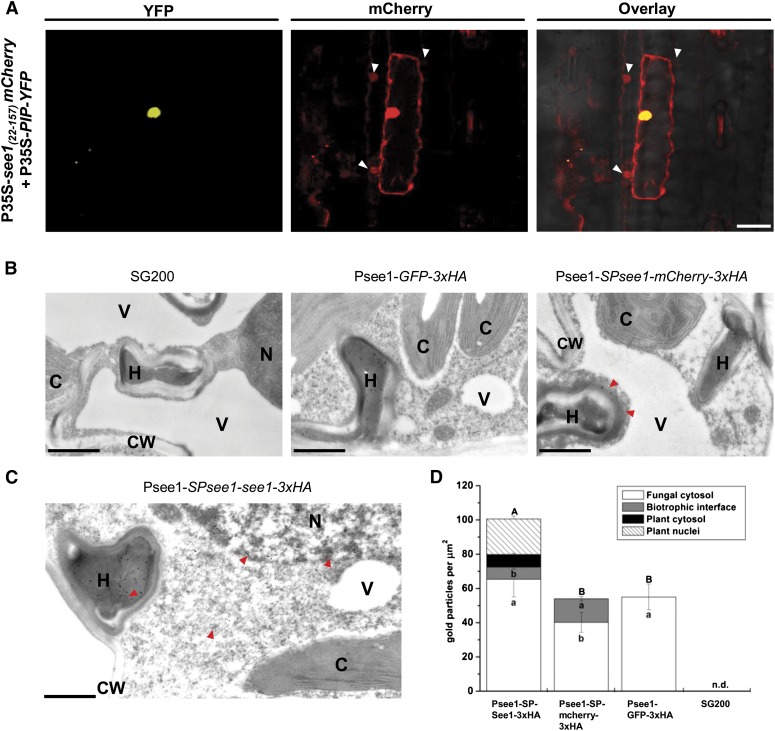
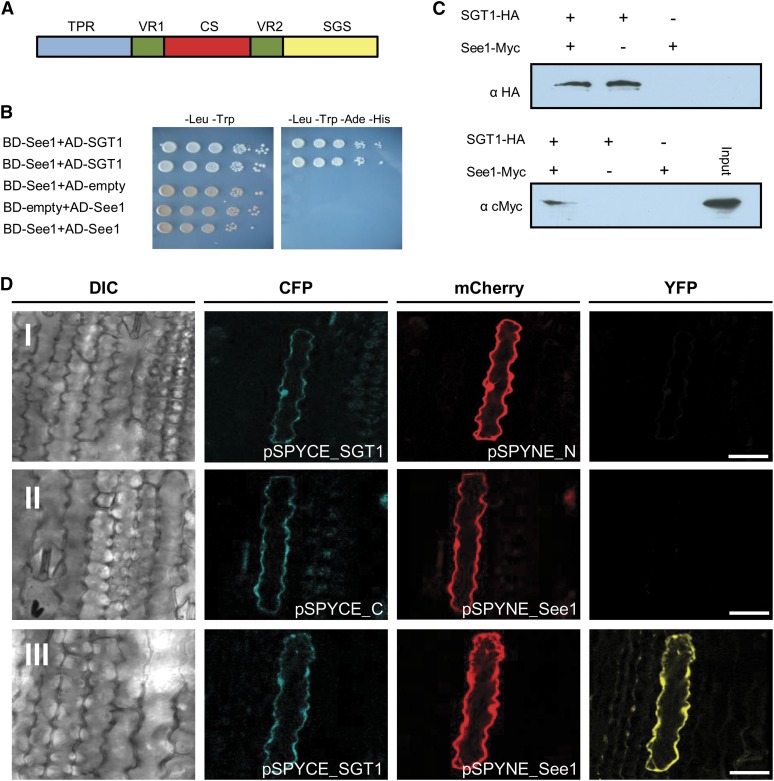
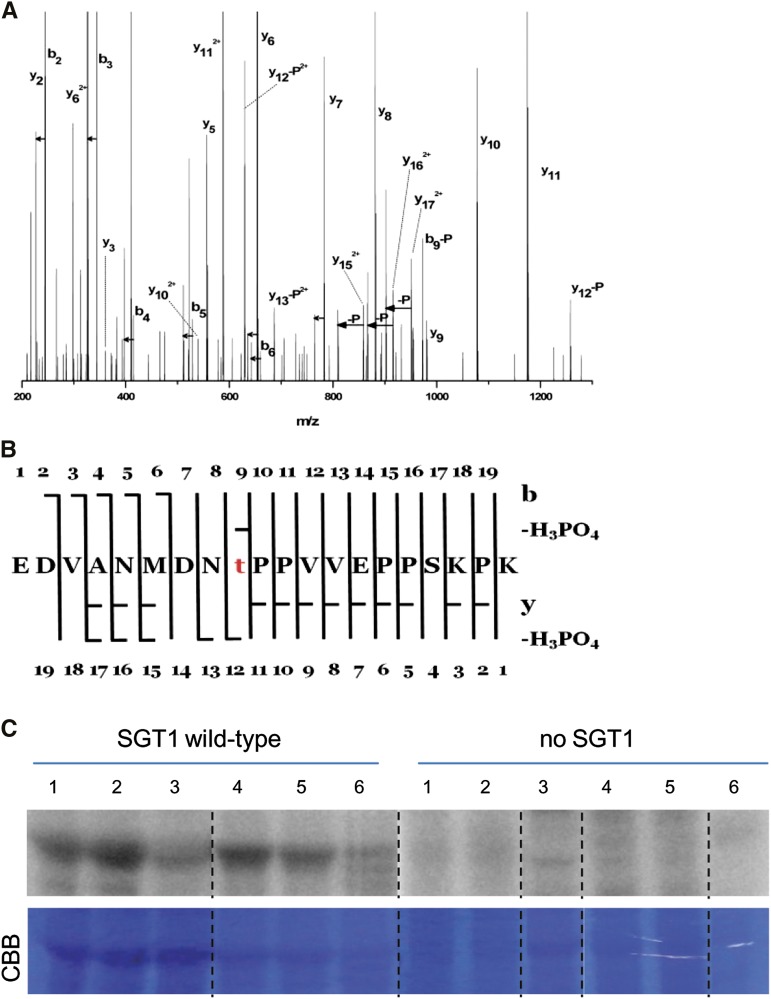
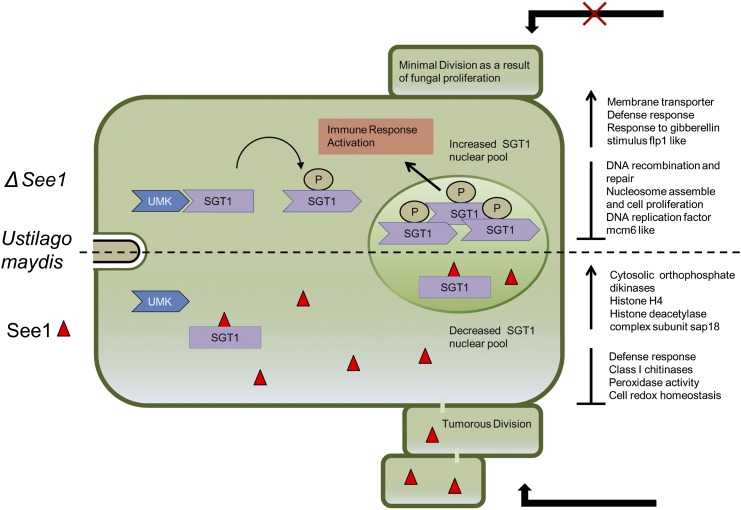
The biotrophic smut fungus Ustilago maydis infects all aerial organs of maize (Zea mays) and induces tumors in the plant tissues. U. maydis deploys many effector proteins to manipulate its host. Previously, deletion analysis demonstrated that several effectors have important functions in inducing tumor expansion specifically in maize leaves. Here, we present the functional characterization of the effector See1 (Seedling efficient effector1). See1 is required for the reactivation of plant DNA synthesis, which is crucial for tumor progression in leaf cells. By contrast, See1 does not affect tumor formation in immature tassel floral tissues, where maize cell proliferation occurs independent of fungal infection. See1 interacts with a maize homolog of SGT1 (Suppressor of G2 allele of skp1), a factor acting in cell cycle progression in yeast (Saccharomyces cerevisiae) and an important component of plant and human innate immunity. See1 interferes with the MAPK-triggered phosphorylation of maize SGT1 at a monocot-specific phosphorylation site. We propose that See1 interferes with SGT1 activity, resulting in both modulation of immune responses and reactivation of DNA synthesis in leaf cells. This identifies See1 as a fungal effector that directly and specifically contributes to the formation of leaf tumors in maize.


Figures

Figure 1.
Figure 1.
Organ-Specific Phenotype of See1 Demonstrating Its Role in Leaves. (A) Disease symptoms caused by SG200∆see1 in comparison with the wild-type progenitor strain SG200 in leaves and tassels. The mutant shows a significant reduction in leaf virulence. Maize seedling leaves were scored at 12 DPI. Disease symptoms in maize tassels were scored at 14 DPI as described by Schilling et al. (2014). SG200, the virulent U. maydis progenitor strain; Δ, deletion mutant for see1; Δ/C, genetic complementation of the deletion strain. The experiment was performed in three independent biological replicates. n = number of plants infected. *P ≤ 0.001. (B) Symptoms caused by U. maydis strain SG200 in comparison with the SG200∆see1 mutant and the complemented strain in leaves and tassels. The leaf photograph shows typical disease symptoms at 12 DPI; the tassel photograph is at 14 DPI. Similar to SG200, the mutant caused disease symptoms in tassels, but leaf tumors were significantly reduced.
Figure 2.
Figure 2.
Gene Expression during Maize Colonization with SG200 and SG200∆see1. (A) RT-qPCR expression profiling of the see1 gene during the biotrophic phase of U. maydis growth in seedling and tassel tissues. Expression levels are shown relative to mean expression of ppi transcripts. Gene expression was analyzed in axenic culture (AC), seedling, and tassel tissues at consecutive time points from 2 to 14 DPI. The experiment was performed in three independent biological replicates. (B) Transcriptional regulation of the key genes involved in the process of DNA synthesis and histone modification between wild-type SG200- and SG200Δsee1 (mutant)-infected seedlings at 6 DPI. Hierarchical clustering was performed by the Partek Genomics Suite version 6.12 to visualize the expression of maize genes transcriptionally regulated at 6 DPI by U. maydis strain SG200 (bottom), infection by SG200Δsee1 (middle), and mock inoculation (top). The x axis depicts clustering of the microarray samples for each of the three biological replicates for each treatment. The y axis shows clustering of the regulated maize transcripts based on the similarity of their expression patterns. red, upregulated genes; green, downregulated genes; black, not significantly altered. LRR, Leu-rich repeat.
Figure 3.
Figure 3.
U. maydis Induces DNA Synthesis in Infected Maize Seedlings. (A) Maize seedlings were infected by U. maydis wild-type strain SG200, and then tissue was incubated in EdU to visualize in vivo DNA synthesis in the host cells. Samples were imaged at 2 and 4 DPI by confocal microscopy. Left, at 2 DPI, the fungal proliferation was observed subepidermally; host cells adjacent to fungal hyphae were considered to be colonized cells (white arrowheads). No EdU incorporation was observed. Right, at 4 DPI, numerous colonized cells showed EdU labeling (green stain), indicating the onset of DNA synthesis in host cells (yellow arrowheads). Bars = 75 μm. (B) Cell division events were observed in maize seedlings infected by U. maydis wild-type strain SG200 at 4 and 5 DPI. EdU incorporation into a cell will result in equally labeled contiguous daughter cells after cell division. Such equally labeled cell pairs were readily observed in SG200-infected seedling leaf tissue. The white arrowheads point to fungal hyphae associated with maize cells undergoing cell division. It is inferred that reactivation of the cell cycle and rapid divisions are responsible for tumor formation. Bars = 25 μm.
Figure 4.
Figure 4.
See1 Requirement for Host Cell Cycle Release in Leaf Tumor Formation. (A) In vivo DNA synthesis in seedling tissue infected with SG200∆see1 in comparison with wild-type SG200. Samples infected with S. reilianum and SG200∆tin3, which has a similar phenotype to SG200∆see1 with respect to tumor size, were used as controls. Fungal hyphae and plant cell walls were visualized by PI staining (red), and the EdU-labeled host cell nuclei are visualized by AF488 staining (green). Fungal hyphae are shown by the white arrowheads. Bar = 100 μm. (B) DNA synthesis in anther tissue infected with SG200∆see1 in comparison with wild-type SG200. Samples infected with the strain overexpressing See1 and uninfected anthers served as controls (right panel). Nuclei were visualized by PI staining (red), and EdU-labeled host cell nuclei are visualized by AF488 staining (green). Fungal hyphae are marked by white arrowheads. Bars = 100 μm. (C) Quantification of the EdU-labeled seedling leaf cells in the in vivo DNA synthesis assay comparing infections with wild-type SG200, SG200∆see1, SG200∆tin3, and S. reilianum. Error bars show se. *P ≤ 0.001. (D) Quantification of the EdU-labeled nuclei relative to total anther nuclei per image examined after infection with wild-type SG200, SG200∆see1, See1-overexpressing strain Ppit2-see1, and noninfected (N.I) tissue. Within the population of EdU-positive cells, the number colonized by fungal hyphae was also quantified in the infected samples. Error bars show se.
Figure 5.
Figure 5.
Overexpression of see1 Results in Tumor Proliferation in Vegetative Tassel Parts. (A) Tassel base abnormality occurs much more frequently with constitutive overexpression of see1 in comparison with the wild-type strain SG200. Tumor formation in the tassel base is indicated by the white arrows. (B) Quantification of see1 gene expression in tassels infected with the overexpressing strain Ppit2-see1 in comparison with plants infected with the wild-type SG200 strain. Error bars show se. *P ≤ 0.001. (C) Quantification of EdU-labeled tassel base cells in the in vivo DNA synthesis assay after infection with the See1-overexpressing strain Ppit2-see1 in comparison with either the wild-type SG200 infected or noninfected (N.I) tassels. There was a significant difference in the number of EdU-labeled nuclei in the abnormal tassel base region as compared with the wild-type SG200 infected or noninfected tissue. Error bars show se. Comparisons a and b, P ≤ 0.05. (D) Detection of in vivo DNA synthesis in the tassel base colonized by See1-overexpressing strain Ppit2-see1 in comparison with tissue colonized by wild-type strain SG200 and noninfected tissue. The total nuclei were visualized by PI staining (red), and the EdU-labeled cell nuclei were visualized by AF488 staining (green). Bar = 50 μm.
Figure 6.
Figure 6.
See1 Localizes to the Plant Cell Cytoplasm and Nucleus. (A) Confocal microscopy of 35S-see122–157-mCherry transiently expressed in maize epidermal cells. Left panel, transformation with the PIP-YFP control results in fluorescence that is specifically localized to the nucleus. Right panel, See1-mCherry is localized to the cytoplasm and nucleus and is transferred to the adjacent neighboring cells, which are shown by the white arrowheads in the mCherry and overlay channels. Bar = 25 μm. (B) Controls for the TEM micrographs showing immunogold labeling of See1-3xHA in leaves of U. maydis-infected maize. No gold particles were bound to wild-type infected tissue specimens (left panel). Gold labeling was restricted to fungal hyphae in GFP-3xHA samples, as GFP was not secreted by the fungus (middle panel). Gold particles bound to the secreted mCherry control could be found in hyphae and at the biotrophic interface (red arrowheads) but not inside the plant cells, despite proximity to hyphae. Psee1-SPsee1-mCherry-3xHA expression demonstrates that mCherry is secreted by the fungus but not taken up by the plant (right panel). Bars = 1 μm. (C) Immunogold labeling of See1 could be found in hyphae (H), the cytosol, and nuclei (N), as shown by the red arrowheads, but not in chloroplasts (C), vacuoles (V), or the cell wall (CW) when the See1 effector was tagged with 3xHA in the strain Psee1-SPsee1-See1-3xHA. Bar = 1 μm. (D) Graph depicts the spatial distribution of gold particles bound to See1-3xHA in different cell compartments of leaves from Psee1-See1-3x-HA along with the secretory (mCherry-3xHA), nonsecreted (GFP-3xHA), and SG200 wild-type controls. Means are shown with se for the number of gold particles per μm2 in the individual cell compartments of three independent transverse sections. Lowercase letters indicate significant differences (P < 0.05) between the individual cell compartments, whereas uppercase letters indicate significant differences between the total sum of labeling signal for all analyzed cell compartments. Data were analyzed with the Kruskal-Wallis test followed by post-hoc comparison according to Conover (1999). n.d., not detected, for all analyzed cell compartments.
Figure 7.
Figure 7.
See1 Interacts with the Cell Cycle and the Immune Response Modulator SGT1. (A) Domain structure of maize SGT1 depicting three important domains: TPR, CS, and SGS. The two variable regions (VR1 and VR2) in the protein are species-specific. (B) Yeast two-hybrid experiment to test for the interaction of See1 and maize SGT1. The drop assay was done by serial dilutions (see Methods), and strains were tested on low- and high-stringency plates to check for the specificity of the interaction. Results were documented after 4 d. (C) Coimmunoprecipitation shows the interaction of See1 and SGT1 fusion proteins isolated from transiently expressing N. benthamiana cells. SGT1 was tag purified, and See1 was pulled down. In the absence of SGT1, no See1 signal was detected. (D) In vivo interaction of See1 with SGT1. Confocal images show maize epidermal cells expressing BiFC constructs. Row I shows a plant cell coexpressing pSPYCE-SGT1 and pSPYNE-mCherry. Blue and red channels show cytoplasmic colocalization of the respective signals. No complementation of fluorescence is observed in the YFP channel. Row II shows the coexpression of pSPYCE-CFP and pSPYNE-See1. Blue and red channels show cytoplasmic colocalization of the respective signals. No complementation of fluorescence is observed in the YFP channel. Row III shows a cell coexpressing pSPYCE-SGT1 and pSPYNE-See1. Both signals colocalize in the nucleus and cytoplasm. The YFP channel exhibits YFP fluorescence reflecting the direct interaction of See1 and SGT1. DIC, differential interference contrast. Bars = 25 μm.
Figure 8.
Figure 8.
In Planta Phosphorylation of Maize SGT1. (A) Fragmentation spectrum assigned to the phosphorylated form of the peptide EDVANMDNTPPVVEPPSKPK (Mascot score 126). Loss of H3PO4 is denoted by –P, loss of water is marked by short horizontal arrows, whereas a longer arrow symbolizes pairs of detected signals corresponding to yn and yn-H3PO4. The majority of signals of the tandem mass spectrometry spectra are assigned to the above species. The presence of several yn>11-H3PO4 and b9-H3PO4 ions accompanied by y15, y16, and y17 pinpoints threonine at position 9 as the unequivocal phosphorylation site within the peptide. (B) Peptide sequence with assigned y, b, y-H2O, b-H2O, y-H3PO4, and b-H3PO4 ions present. (C) Recombinant maize SGT1 produced in E. coli was incubated in the buffer containing [γ-32P]ATP, and total proteins were extracted from maize seedlings or tassels infected by various U. maydis strains. The samples were fractionated by SDS-PAGE and analyzed with a phosphor imager. Columns 1 to 3, extracts from seedling leaves 6 DPI with U. maydis wild-type SG200 (1), SG200∆see1 (2), or mock-inoculated (3). Columns 4 to 6, extracts from tassel base 9 DPI with U. maydis wild-type SG200 (4), U. maydis-overexpressing Ppit2:see1 (single-copy integration; 5), or U. maydis-overexpressing Ppit2:see1 (multiple-copy integration; 6). Representative data of four independent biological replicates are shown. CBB, Coomassie Brilliant Blue.
Figure 9.
Figure 9.
Tentative Model of the Role of the See1-SGT1 Interaction during U. maydis Tumor Formation. The SGT1 protein is known to occur in the cytoplasmic and nuclear pools (Hoser et al., 2013). In U. maydis wild-type infections, activated unidentified maize kinase (UMK) triggers the phosphorylation of SGT1 at a monocot-specific target site. The See1 effector binds to SGT1, interferes with its phosphorylation status, and thereby disturbs the subcellular distribution (i.e., transport into the nucleus). This misbalancing of SGT1 phosphorylation and distribution contributes to the induction of cell cycle genes, leading to the induction of tumorous division.

References

    1. Austin M.J., Muskett P., Kahn K., Feys B.J., Jones J.D., Parker J.E. (2002). Regulatory role of SGT1 in early R gene-mediated plant defenses. Science 295: 2077–2080. - PubMed
    1. Azevedo C., Sadanandom A., Kitagawa K., Freialdenhoven A., Shirasu K., Schulze-Lefert P. (2002). The RAR1 interactor SGT1, an essential component of R gene-triggered disease resistance. Science 295: 2073–2076. - PubMed
    1. Bao Z., Yang H., Hua J. (2013). Perturbation of cell cycle regulation triggers plant immune response via activation of disease resistance genes. Proc. Natl. Acad. Sci. USA 110: 2407–2412. - PMC - PubMed
    1. Bhavsar A.P., et al. (2013). The Salmonella type III effector SspH2 specifically exploits the NLR co-chaperone activity of SGT1 to subvert immunity. PLoS Pathog. 9: e1003518. - PMC - PubMed
    1. Brefort T., Doehlemann G., Mendoza-Mendoza A., Reissmann S., Djamei A., Kahmann R. (2009). Ustilago maydis as a pathogen. Annu. Rev. Phytopathol. 47: 423–445. - PubMed

Publication types

MeSH terms