. 2015 Apr 17:13:26.
doi: 10.1186/s12915-015-0138-0.

Long-range regulatory interactions at the 4q25 atrial fibrillation risk locus involve PITX2c and ENPEP

Affiliations

Long-range regulatory interactions at the 4q25 atrial fibrillation risk locus involve PITX2c and ENPEP

Luis A Aguirre et al. BMC Biol. .

Abstract

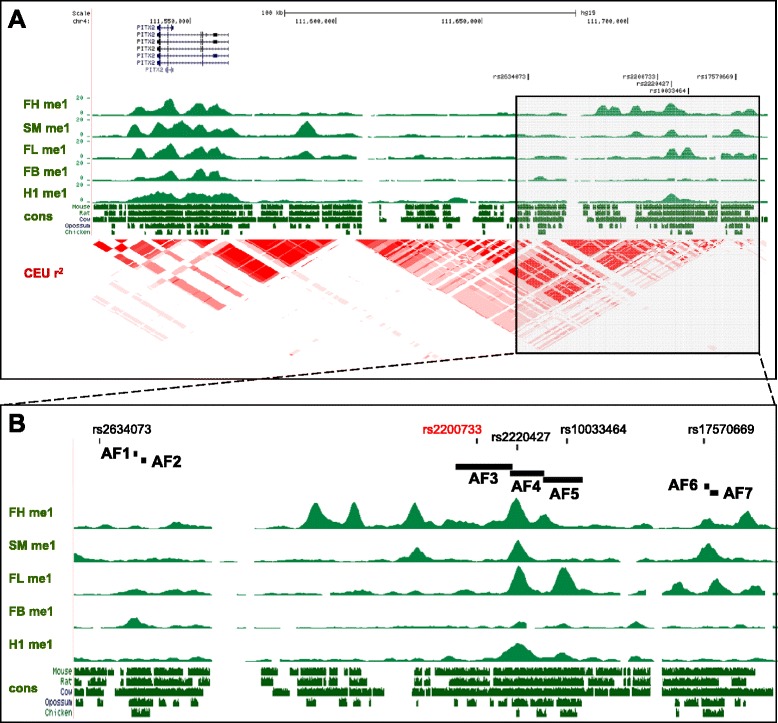
Background: Recent genome-wide association studies have uncovered genomic loci that underlie an increased risk for atrial fibrillation, the major cardiac arrhythmia in humans. The most significant locus is located in a gene desert at 4q25, approximately 170 kilobases upstream of PITX2, which codes for a transcription factor involved in embryonic left-right asymmetry and cardiac development. However, how this genomic region functionally and structurally relates to PITX2 and atrial fibrillation is unknown.

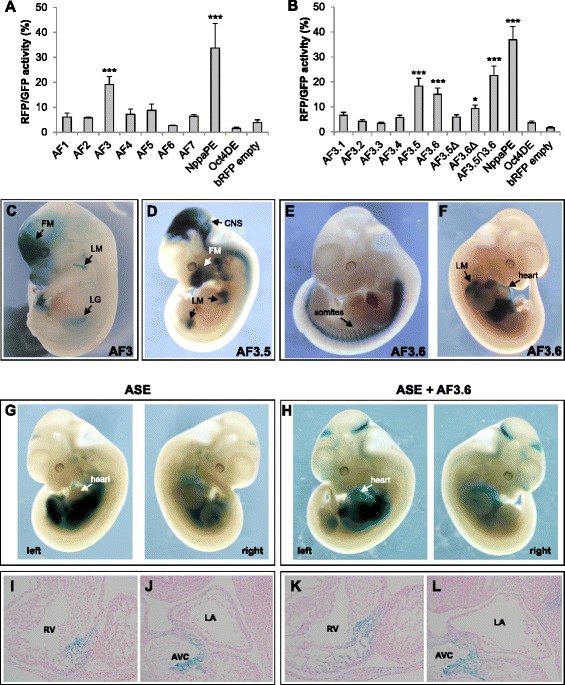
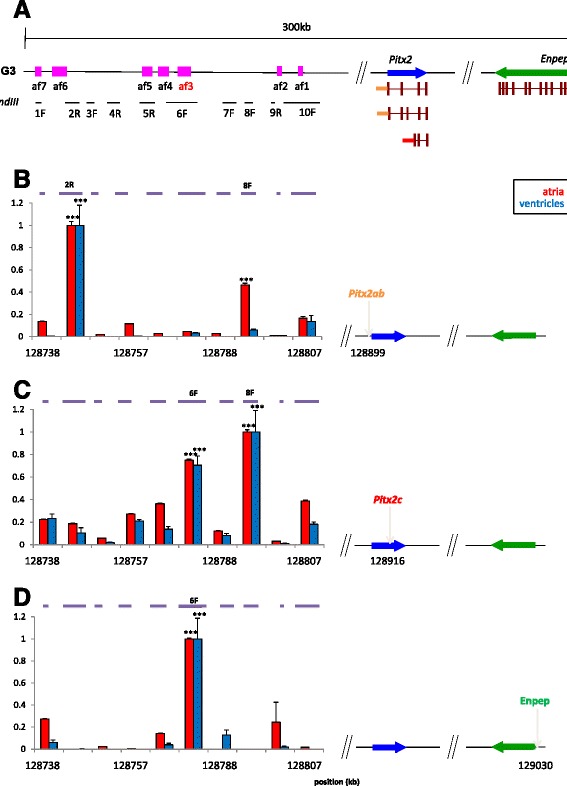
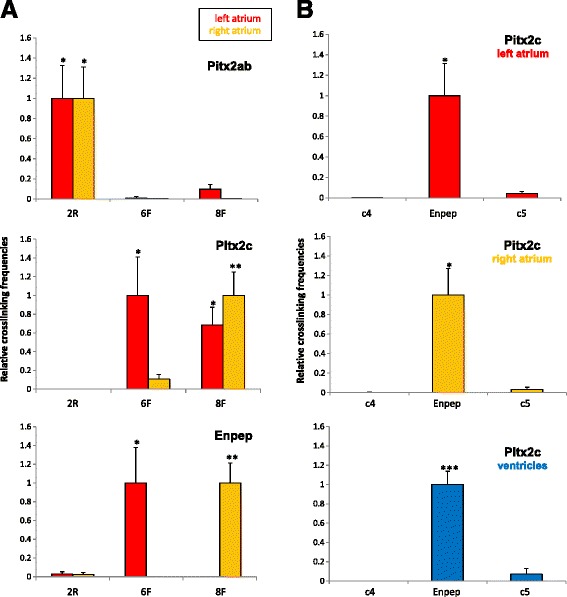
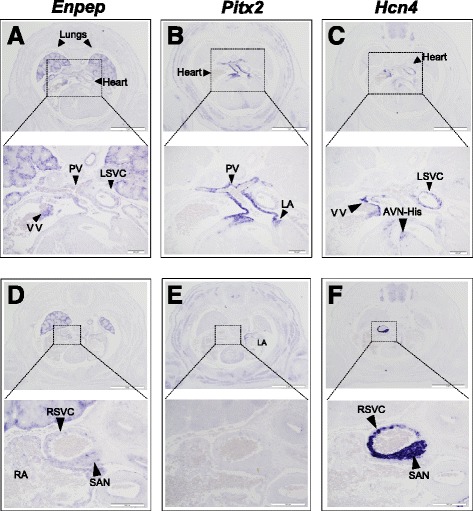
Results: To characterise its function, we tested genomic fragments from 4q25 for transcriptional activity in a mouse atrial cardiomyocyte cell line and in transgenic mouse embryos, identifying a non-tissue-specific potentiator regulatory element. Chromosome conformation capture revealed that this region physically interacts with the promoter of the cardiac specific isoform of Pitx2. Surprisingly, this regulatory region also interacts with the promoter of the next neighbouring gene, Enpep, which we show to be expressed in regions of the developing mouse heart essential for cardiac electrical activity.

Conclusions: Our data suggest that de-regulation of both PITX2 and ENPEP could contribute to an increased risk of atrial fibrillation in carriers of disease-associated variants, and show the challenges that we face in the functional analysis of genome-wide disease associations.


Figures

Figure 1
Figure 1
Genomic landscape of the atrial-fibrillation associated region 4q25. (A) A 230 kb view of the 4q25 (hg19; chr4:111,516,448-111,747,857) gene desert, showing the position of AF risk-associated SNPs (vertical black bars) distal to PITX2. The different PITX2 isoforms of the gene are shown above with PITX2c, the main cardiac isoform, on top. Below, UCSC tracks of the region showing the distribution of H3K4me1 marks (me1) in foetal heart (FH), smooth muscle (SM), foetal liver (FL), foetal brain (FB) and human embryonic stem cells (H1); the conservation (cons) between human and mouse, rat, cow, opossum and chicken; and the linkage disequilibrium structure from the HapMap Project (CEU r2). (B) A 85 kb zoom of the shaded rectangle shown in A (hg19; chr4:111,662,786-111,747,668) indicating the fragments (AF1-AF7) tested for regulatory activity in this study. The lead AF risk associated SNP rs2200733 is highlighted in red. AF, atrial fibrillation; UCSC, University of California Santa Cruz genome browser.
Figure 2
Figure 2
Regulatory activity of 4q25 genomic elements in cultured HL-1 atrial cardiomyocytes and in transgenic mouse embryos. (A) HL-1 transfection assays with the 4q25 fragments AF1 to AF7 show that only AF3 exhibits regulatory activity (P = 0.0004) as compared with the positive (NppaPE) and negative (Oct4DE, bRFP) controls. (B) Transfection assays of AF3.1 to AF3.6 overlapping fragments; only AF3.5 (P = 0.0002) and AF3.6 (P = 0.0006) show significant activity. Deletion of the overlapping fragment between them, which itself shows strong activity (AF3.5∩3.6; P = 0.00004), abrogates activity of AF3.5 (AF3.5Δ) but not of AF3.6 (AF3.6Δ; P = 0.02). (C) AF3 drives lacZ reporter expression in E13.5 transgenic mice embryos to different sites, such as the facial mesenchyme (FM), limb muscles (LM), and the left gonad (LG). (D-F) Activity in embryonic day (E) 10.5 to 11.5 transgenic embryos of AF3.5 (D) and AF3.6 (E, F) is highly variable, driving expression in diverse sites, such as the central nervous system (CNS) or facial mesenchyme (D), limb muscles (D, F), somites (E), and heart (F). (G) Reporter activity driven by the PITX2 ASE element is preferentially localised to the left side with weak expression in the cardiac region. (H) The chimeric ASE + AF3.6 construct behaves in a similar way to ASE but with increased cardiac expression. (I-J) Sections of the embryos shown in G and H, comparing the region of the right ventricle (RV) of ASE (I) and ASE + AF3.6 (K), which shows a broader domain of reporter expression. Similarly, expression in the atrioventricular canal (AVC) is broader in ASE + AF3.6 (L) compared to ASE (J). For A and B, data are expressed as mean ± SEM. Statistical significance versus empty pβRFP was calculated by unpaired Student’s t-test. *P <0.05, ***P <0.001. LA, left atrium. ASE, asymmetric enhancer; SEM, standard error of the mean.
Figure 3
Figure 3
Long-range chromatin interactions in the mouse Pitx2 genomic locus. (A) Schematic representation of a 300 kb region of the mouse genome syntenic to human 4q25. The approximate locations of regions orthologous to human AF1-AF7 are indicated by pink boxes (af1 to af7; af3, in red, is orthologous to human AF3, which contains the lead SNP rs2200733). The promoter regions from which anchor primers for 3C were generated are indicated (Pitx2ab, blue; Pitx2c, red; Enpep, green). Genomic HindIII fragments tested for their interaction with anchor promoter primers are represented by black horizontal bars (1 to 10; F and R denote primer design). (B-D) Normalised 3C interactions, expressed as crosslinking frequencies (y-axis), between the test fragments and the promoters of Pitx2ab (B), Pitx2c (C) and Enpep (D) in atria (red) and ventricle (blue). In each graph, the highest crosslinking frequency values were set to 1. Genome coordinates (x-axis) are from the mouse NCBI37/mm9 assembly. Statistical significance was assessed following one-way ANOVA test of Student-Newman-Keuls. ***P <0.001. Error bars represent ± SEM. ANOVA, analysis of variance; SEM, standard error of the mean; 3C, chromosome conformation capture.
Figure 4
Figure 4
Differential chromatin interactions of Pitx2 and Enpep in left and right atrium. (A) Normalised 3C interactions, expressed as crosslinking frequencies (y-axis), between fragments 2R, 6F and 8F, and the promoters of Pitx2ab, Pitx2c and Enpep, in left (red) and right (yellow) atrium. (B) 3C interaction between the Pitx2c and Enpep promoters, including control regions upstream (c4) and downstream (c5) of Enpep (see Additional file 5), in left (red) and right (yellow) atrium, as well as in ventricles (blue). In each graph, the highest crosslinking frequency values were set to 1. Statistical significance was assessed following one-way ANOVA test of Student-Newman-Keuls. *P <0.05, **P <0.01, ***P <0.001. Error bars represent ± SEM. ANOVA, analysis of variance; SEM, standard error of the mean; 3C, chromosome conformation capture.
Figure 5
Figure 5
Enpep is expressed in the embryonic mouse heart. (A to F) Expression of Enpep (A, D), Pitx2 (B, E) and Hcn4 (C, F) in E14.5 mouse embryos shown by in situ hybridization on two sets of consecutive sections (A to C and D to F). In addition to strong expression in the endothelial lining of the lungs, Enpep is expressed in a restricted pattern in the heart (A, D), where it is co-expressed with Pitx2 in the pulmonary veins (PV; zoom in A and B) and with Hcn4 in the leaflet of the venous valve (VV) and left superior vena cava (LSVC; zoom in A and C) as well as in the right superior vena cava (RSVC) and sinoatrial node (SAN; zoom in D and F). It is noteworthy that Enpep is not expressed in the myocardium of the left atria (LA), as is Pitx2 (zoom in B and E). AVN-His, atrial ventricular node-bundle of His; RA, right atria. Scale bars, 1 mm; close-ups, 200 μm. E, embryonic day.

References

    1. Manolio TA. Genomewide association studies and assessment of the risk of disease. N Engl J Med. 2010;363:166–176. doi: 10.1056/NEJMra0905980. - DOI - PubMed
    1. Manolio TA. Bringing genome-wide association findings into clinical use. Nat Rev Genet. 2013;14:549–558. doi: 10.1038/nrg3523. - DOI - PubMed
    1. Paul DS, Soranzo N, Beck S. Functional interpretation of non-coding sequence variation: concepts and challenges. Bioessays. 2014;36:191–199. doi: 10.1002/bies.201300126. - DOI - PMC - PubMed
    1. Smemo S, Tena JJ, Kim KH, Gamazon ER, Sakabe NJ, Gomez-Marin C, et al. Obesity-associated variants within FTO form long-range functional connections with IRX3. Nature. 2014;507:371–375. doi: 10.1038/nature13138. - DOI - PMC - PubMed
    1. Kirchhof P, Curtis AB, Skanes AC, Gillis AM, Samuel Wann L, John CA. Atrial fibrillation guidelines across the Atlantic: a comparison of the current recommendations of the European Society of Cardiology/European Heart Rhythm Association/European Association of Cardiothoracic Surgeons, the American College of Cardiology Foundation/American Heart Association/Heart Rhythm Society, and the Canadian Cardiovascular Society. Eur Heart J. 2013;34:1471–1474. doi: 10.1093/eurheartj/ehs446. - DOI - PubMed

Publication types

MeSH terms