

The geography of post-disaster mental health: spatial patterning of psychological vulnerability and resilience factors in New York City after Hurricane Sandy
- PMID: 25889102
- PMCID: PMC4461997
- DOI: 10.1186/s12942-015-0008-6
The geography of post-disaster mental health: spatial patterning of psychological vulnerability and resilience factors in New York City after Hurricane Sandy
Abstract
Background: Only very few studies have investigated the geographic distribution of psychological resilience and associated mental health outcomes after natural or man made disasters. Such information is crucial for location-based interventions that aim to promote recovery in the aftermath of disasters. The purpose of this study therefore was to investigate geographic variability of (1) posttraumatic stress (PTS) and depression in a Hurricane Sandy affected population in NYC and (2) psychological vulnerability and resilience factors among affected areas in NYC boroughs.
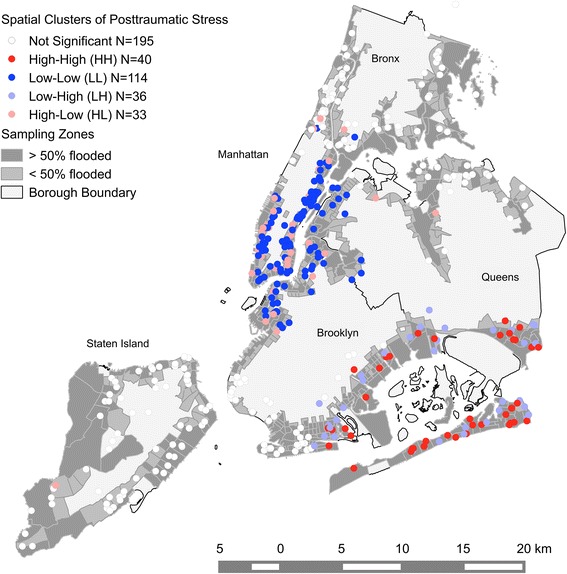
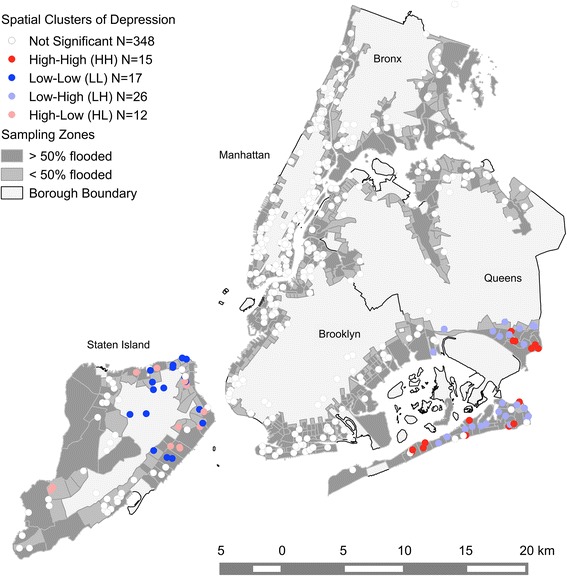
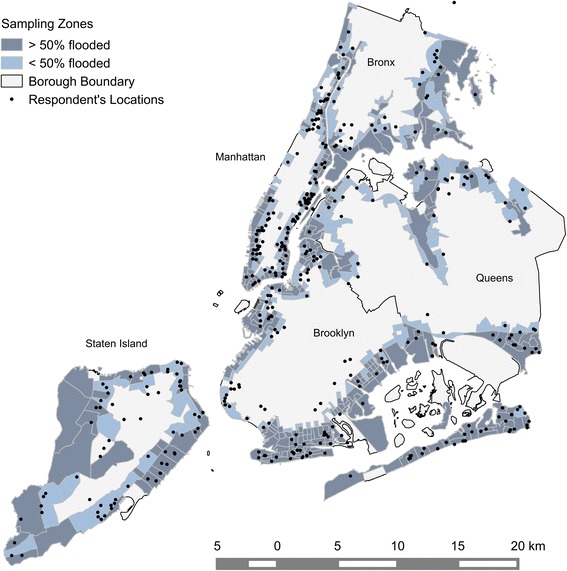
Methods: Cross-sectional telephone survey data were collected 13 to 16 months post-disaster from household residents (N = 418 adults) in NYC communities that were most heavily affected by the hurricane. The Posttraumatic Stress Checklist for DSM-5 (PCL-5) was applied for measuring posttraumatic stress and the nine-item Patient Health Questionnaire (PHQ-9) was used for measuring depression. We applied spatial autocorrelation and spatial regimes regression analyses, to test for spatial clusters of mental health outcomes and to explore whether associations between vulnerability and resilience factors and mental health differed among New York City's five boroughs.
Results: Mental health problems clustered predominantly in neighborhoods that are geographically more exposed towards the ocean indicating a spatial variation of risk within and across the boroughs. We further found significant variation in associations between vulnerability and resilience factors and mental health. Race/ethnicity (being Asian or non-Hispanic black) and disaster-related stressors were vulnerability factors for mental health symptoms in Queens, and being employed and married were resilience factors for these symptoms in Manhattan and Staten Island. In addition, parental status was a vulnerability factor in Brooklyn and a resilience factor in the Bronx.
Conclusions: We conclude that explanatory characteristics may manifest as psychological vulnerability and resilience factors differently across different regional contexts. Our spatial epidemiological approach is transferable to other regions around the globe and, in the light of a changing climate, could be used to strengthen the psychosocial resources of demographic groups at greatest risk of adverse outcomes pre-disaster. In the aftermath of a disaster, the approach can be used to identify survivors at greatest risk and to plan for targeted interventions to reach them.
Figures
Similar articles
-
Psychological resilience after Hurricane Sandy: the influence of individual- and community-level factors on mental health after a large-scale natural disaster.PLoS One. 2015 May 11;10(5):e0125761. doi: 10.1371/journal.pone.0125761. eCollection 2015. PLoS One. 2015. PMID: 25962178 Free PMC article.
-
Community Unemployment and Disaster-Related Stressors Shape Risk for Posttraumatic Stress in the Longer-Term Aftermath of Hurricane Sandy.J Trauma Stress. 2016 Oct;29(5):440-447. doi: 10.1002/jts.22126. Epub 2016 Oct 3. J Trauma Stress. 2016. PMID: 27696535
-
The Geography of Mental Health and General Wellness in Galveston Bay After Hurricane Ike: A Spatial Epidemiologic Study With Longitudinal Data.Disaster Med Public Health Prep. 2016 Apr;10(2):261-73. doi: 10.1017/dmp.2015.172. Epub 2016 Jan 28. Disaster Med Public Health Prep. 2016. PMID: 26818684
-
A scoping review of health risks and outcomes from disasters in the Republic of Korea.BMC Public Health. 2025 Apr 11;25(1):1369. doi: 10.1186/s12889-025-22362-7. BMC Public Health. 2025. PMID: 40217450 Free PMC article.
-
Scoping review on trauma and recovery in youth after natural disasters: what Europe can learn from natural disasters around the world.Eur Child Adolesc Psychiatry. 2024 Mar;33(3):651-665. doi: 10.1007/s00787-022-01983-y. Epub 2022 Apr 15. Eur Child Adolesc Psychiatry. 2024. PMID: 35426528 Free PMC article.
Cited by
-
Wind disasters adaptation in cities in a changing climate: A systematic review.PLoS One. 2021 Mar 17;16(3):e0248503. doi: 10.1371/journal.pone.0248503. eCollection 2021. PLoS One. 2021. PMID: 33730069 Free PMC article.
-
Mapping concentrations of posttraumatic stress and depression trajectories following Hurricane Ike.Sci Rep. 2016 Aug 25;6:32242. doi: 10.1038/srep32242. Sci Rep. 2016. PMID: 27558011 Free PMC article. Clinical Trial.
-
Predictive Factors for Impaired Mental Health among Medical Students during the Early Stage of the COVID-19 Pandemic in Morocco.Am J Trop Med Hyg. 2021 Jan;104(1):95-102. doi: 10.4269/ajtmh.20-1302. Am J Trop Med Hyg. 2021. PMID: 33205748 Free PMC article.
-
Long-term effects of disaster on depressive symptoms: Type of exposure matters.Soc Sci Med. 2018 Nov;217:84-91. doi: 10.1016/j.socscimed.2018.09.062. Epub 2018 Oct 2. Soc Sci Med. 2018. PMID: 30296694 Free PMC article.
-
Regional Differentiation and Influencing Factor Analysis of Residents' Psychological Status during the Early Stage of the COVID-19 Pandemic in South China.Int J Environ Res Public Health. 2021 Nov 15;18(22):11995. doi: 10.3390/ijerph182211995. Int J Environ Res Public Health. 2021. PMID: 34831750 Free PMC article.
References
-
- Bloomberg M, PlaNYC Program . A Stronger, More Resilient New York. New York, NY: City of New York; 2013.
-
- Tropical Cyclone Report Hurricane Sandy (AL182012) [http://www.nhc.noaa.gov/data/tcr/AL182012_Sandy.pdf]
-
- Kunz M, Muehr B, Kunz-Plapp T, Daniell JE, Khazai B, Wenzel F, et al. Investigation of superstorm Sandy 2012 in a multi-disciplinary approach. Nat Hazards Earth Syst Sci. 2013;13:2579–98. doi: 10.5194/nhess-13-2579-2013. - DOI
-
- New York City Community Development Block Grant-Disaster Recovery [NYC CDBG-DR] [www.nyc.gov/cdbg]
Publication types
MeSH terms
Grants and funding
LinkOut - more resources
Full Text Sources
Other Literature Sources
Medical
